Introduction
Understanding income trends in South Africa requires diving deep into robust data. Much of this research relies on the Spatial Tax Panel (STP), an initiative that officially originated as an open-access project in July 2021 through a partnership between the National Treasury and the Human Sciences Research Council (HSRC), building on an earlier 2015 foundational collaboration with the United Nations University World Institute for Development Economics Research (UNU-WIDER).
At Codera Analytics, we provide a free subset of this powerful dataset in easy to use form via our EconData database. Users can explore dimensions such as gender, age category, province, district, and SICv7 industry sections (A-U). The available metrics include median income, mean income, and full-time equivalent employment, all restricted to the formal sector. The time dimension covers the 2013/2014 tax year to the most recent full tax year, with roughly a six-month delay. For more detailed information, users can consult our user guide.
The Core Debate: Is Median Income Flat or Falling?
When examining the STP data, the median income variable gives a flat trend in nominal terms. The official version 6 metadata document notes that end-users can adjust these nominal values to real values (page 12). Deflating the nominal median income using the consumer price index reveals a concerning declining trend over the past decade.
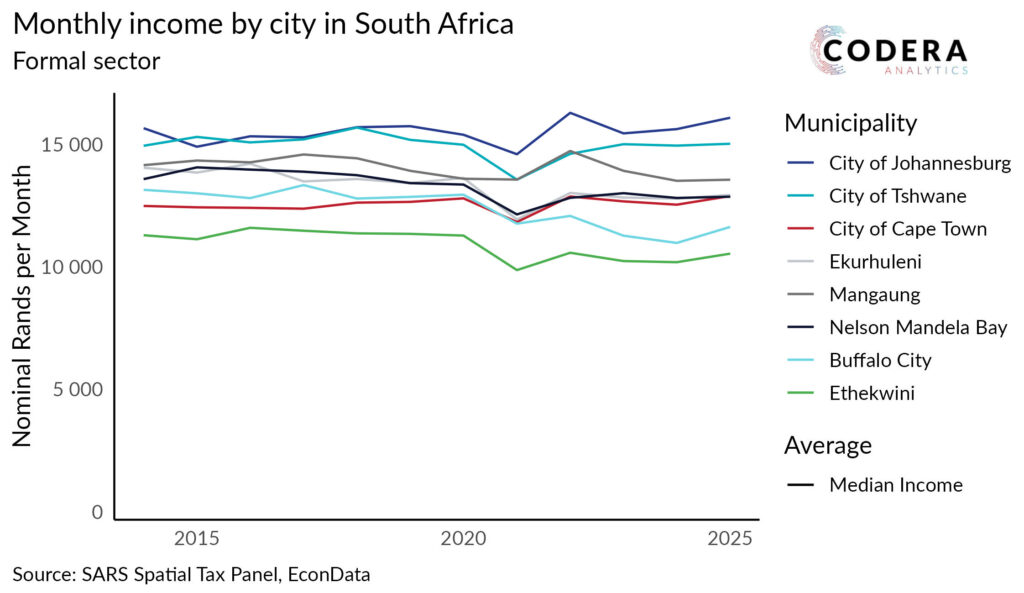
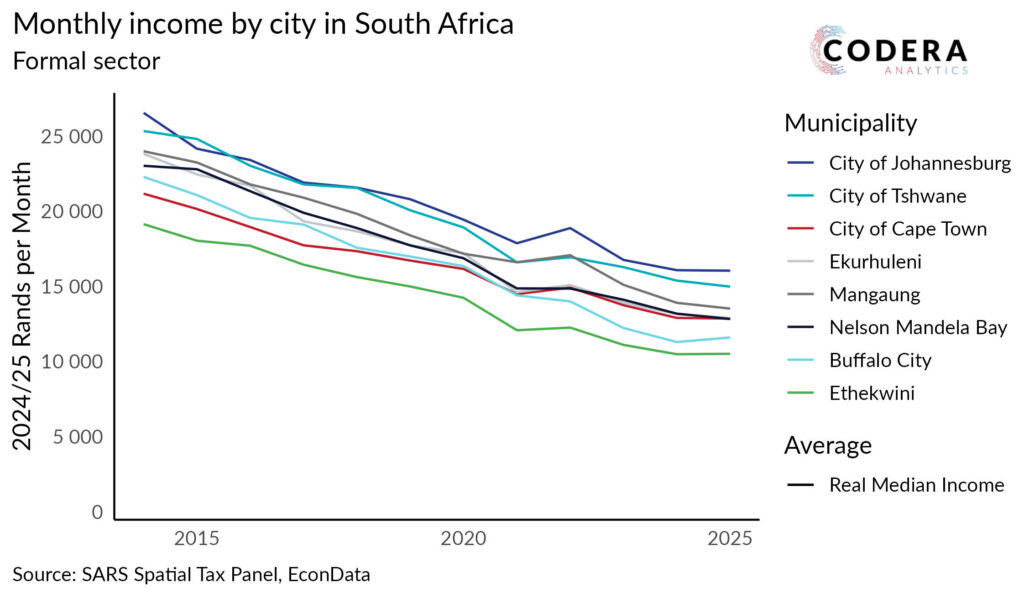
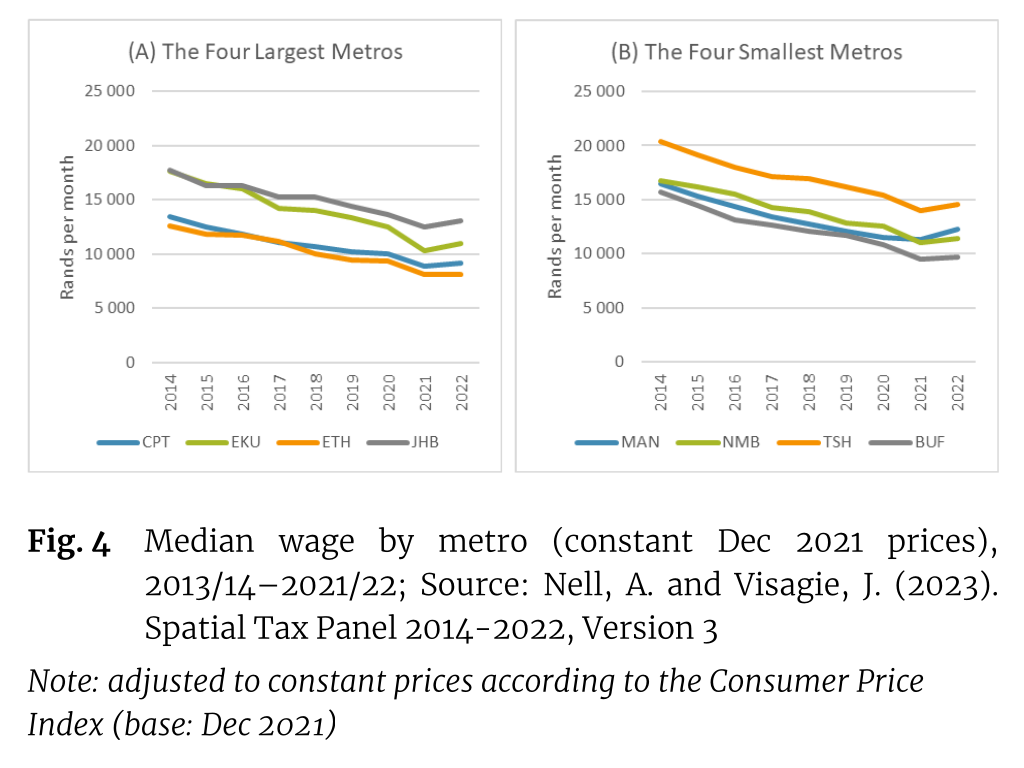
This aligns with findings by Dlamini and Visagie (2023: 80–81), who identified evidence of a severe erosion in median wages across all metropolitan areas over the past eight years. Their research suggests that the median wage worker in South African cities is getting poorer because middle-tier wages have not kept pace with inflation. The overall impression is clear: median worker earnings across the metros have deteriorated over the past eight years, which reflects South Africa’s sustained poor economic growth.
Contrasting Evidence: A Flat Long-Term Trend
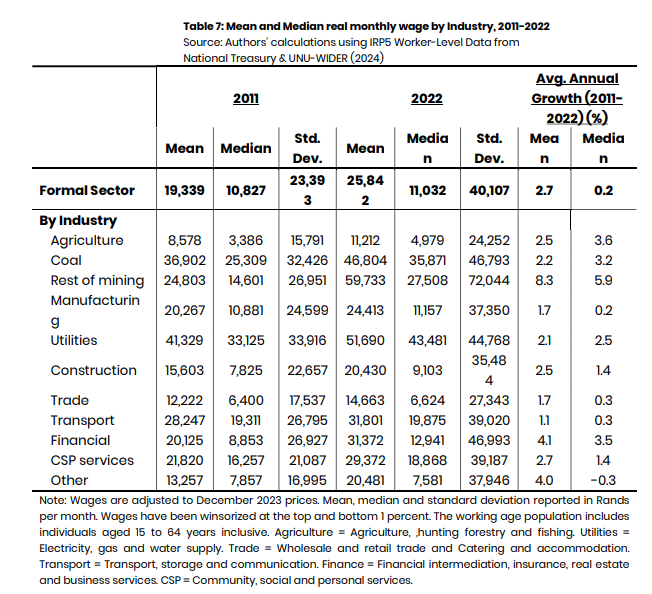
While the STP data suggests a decline, other researchers point to a flat trend. This contrasts with research by Bhorat et al (2024: 39), who analysed anonymised employer-employee IRP5 tax certificates from the National Treasury Secure Data Facility—the exact same underlying data source as the STP. They found that the real median wage for the formal sector as a whole was R 10 827 in 2011 and R 11 032 in 2022, implying a flat overall trend.
This flat, stagnant long-term trend is supported by a broader consensus using both refined IRP5 tax data and harmonized household survey data. For instance, the National Planning Commission (2024: 81) found that real median wages grew by a virtually flat average of just 0.5% per annum over a 12-year period, eventually declining to R7,300 by 2023. Similarly, Wittenberg (2014: 3–4) showed that between 1994 and 2011, median real earnings grew at only 1.26% annually, lagging significantly behind mean earnings and causing the top end of the distribution to shift rapidly away from the median. However, the Alternative Information & Development Centre (2014) further noted a long-term erosion, observing that the 2011 median wage remained 7.2% below its 1997 level in real terms. Perhaps the STP is showing a more recent declining trend, where the trend has historically been flat.
Nuance in the Distribution: A Hollowing Out
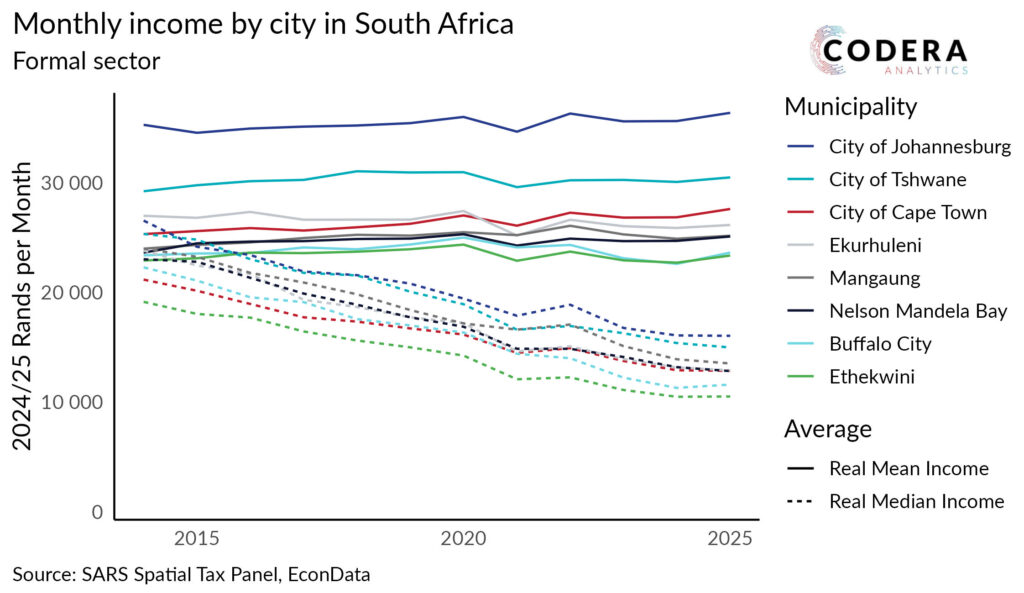
What explains these conflicting pictures of decline and stagnation? By averaging the mid-points of real wage bands in the STP, weighted by employment, we can estimate real mean income—a method also used by Dlamini and Visagie (page 85). Doing so exposes a surprising widening ratio between a flat real mean income and a declining real median income over time.
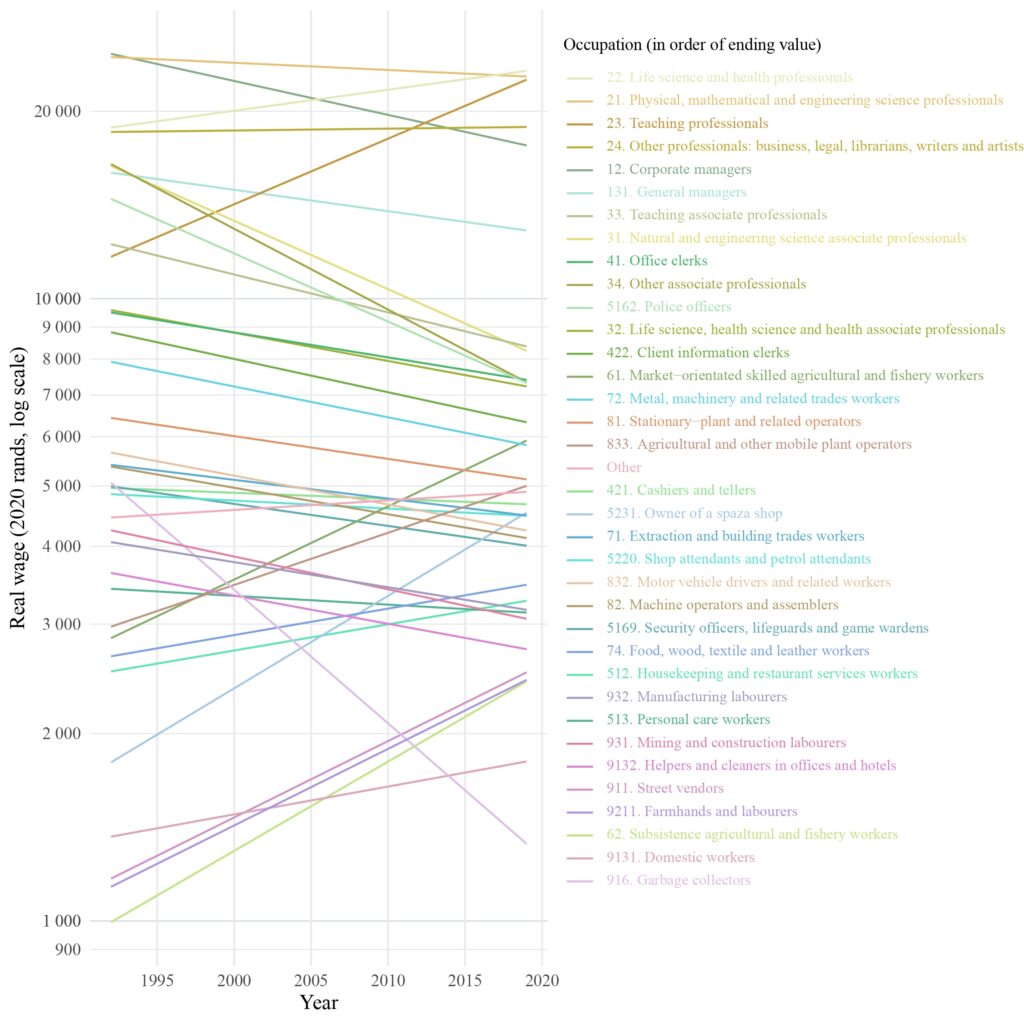
This suggests that inequality is increasing, yet Dlamini and Visagie report flat Gini coefficients in their research. Kerr (2020) also reports a flat trend in inequality between 2011 and 2017. The answer likely lies in the polarization, or “hollowing out,” of the middle earning distribution. Horn, Leibbrandt and Donaldson (2025: 13) provide evidence of this: their estimates show declining real earnings in the middle of the occupational distribution, coupled with rising wage rates at the bottom. This dynamic allows the median to decline while overall inequality remains unchanged.
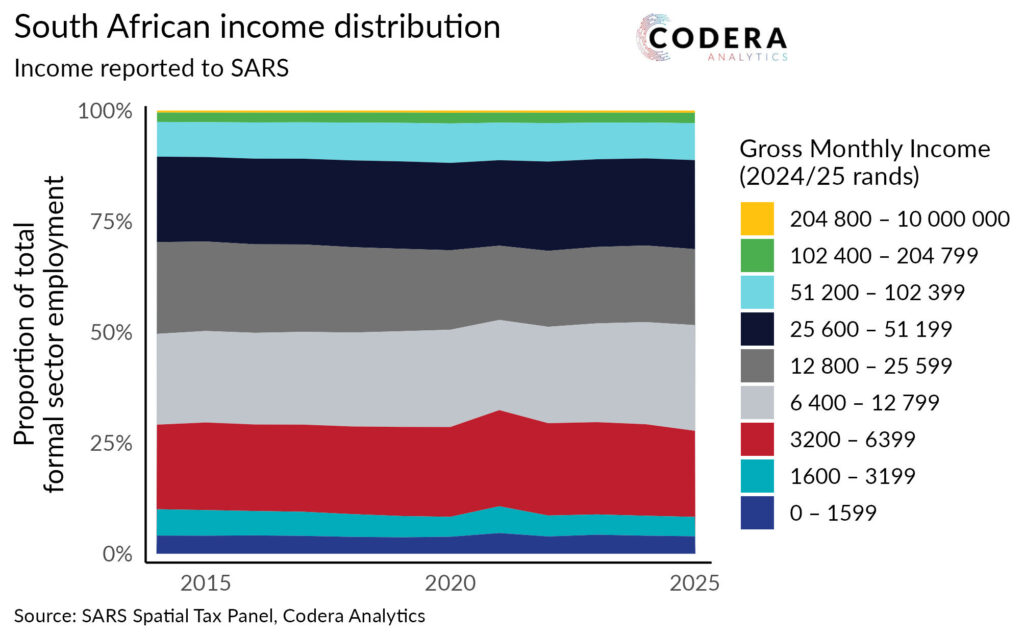
However, looking strictly at how the distribution has progressed over time in the Spatial Tax Panel, the median hovers steadily around R12 800 per month (in 2024/25 tax year rands) for the entire recorded period.
Conclusion
Most evidence, from both the SARS income tax data as well as household surveys, points to a flat real median income trend. We hope that this article provides transparency about this series in the Spatial Tax Panel and offers guidance for productive debate. Ultimately, despite short-term fluctuations and a “hollowing out” of the middle distribution, the median South African worker has experienced persistent wage stagnation, seeing virtually no meaningful long-term increase in real wages.
References
- Alternative Information & Development Centre (AIDC). (2014). Wage Trends and the Erosion of the Labour Share in South Africa. Cape Town: AIDC.
- Bhorat, H., Martin, L., Monnakgotla, J., & Steenkamp, F. (2025). Counting and Profiling Coal Mining Industry Jobs: A Guideline to Using Administrative Data. Development Policy Research Unit Working Paper 202501. DPRU, University of Cape Town. (Also published as Éditions Agence française de développement 351, June 2025).
- Dlamini, M., and Visagie, J. (2023). Cities are at the Centre of South Africa’s Wage Inequalities. Published in the Cities Economic Outlook 2023: Insights into South Africa’s Spatial Economy from Tax Data.
- Horn, A.J., Leibbrandt, M. & Donaldson, A. (2025). Occupational Polarization in South Africa: Evidence from the Post-Apartheid Labour Market Series. (SALDRU working paper 312). Available: https://www.opensaldru.uct.ac.za/handle/11090/1047
- Kerr, A. (2020). Earnings in the South African Revenue Service IRP5 Data. (UNU-WIDER Working Paper 2020/62).
- National Planning Commission (NPC). (2024). Trends in the Cost of Living in South Africa Research Report. Pretoria: The Presidency, Republic of South Africa.
- Wittenberg, M. (2014). Wages and wage inequality in South Africa 1994-2011: The evidence from household survey data. REDI3x3 Working Paper 4. Cape Town: Research Project on Employment, Income Distribution and Inclusive Growth.
Author
Aidan Horn