Bank impairments in SA
Codera today released a new banking dashboard today. The dashboard will have a free to use trial version during July 2023 and consists of over 300 accounting line items per bank, per month, and additional custom indicators developed by Codera. One of the custom indicators available on the dashboard is the ratio of impairments to total loans for each bank …

Spending on official statistics in major economies
Official statistics play a crucial role in informing policy decisions and providing a comprehensive understanding of the state of a nation’s economy. While most countries have national statistical agencies, the amount of funding allocated to these agencies varies significantly across countries. In this post, we compare national spending on official statistics in several countries around the world. South Africa spends a …

Launch of SAMADB Database and Nowcast
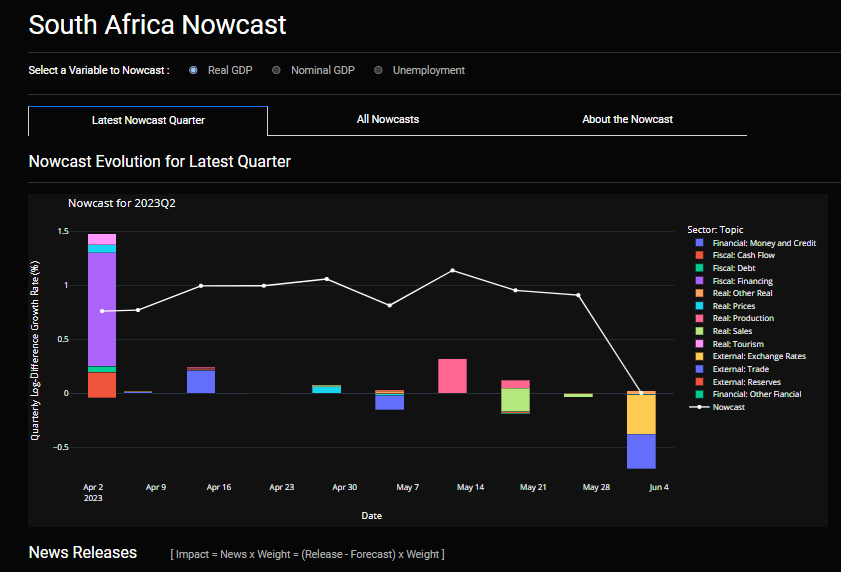
We are pleased to announce the launch of the South Africa Macroeconomic Database (SAMADB) and Nowcast. SAMADB is a free analytical macroeconomic database, offering over 10 000 time series for South Africa collected from the Quarterly Bulletin, EconData and STATSSA, with weekly updates (every Thursday).
(Please note we have paused SAMADB while we upgrade EconData)

Decline in South Africa’s GDP per capita
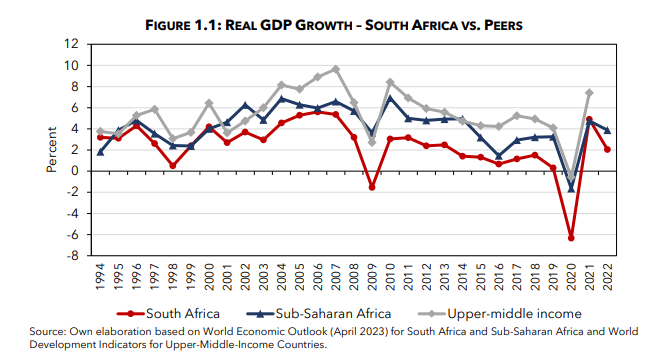
South Africa is one of only a small number of large economies that have experienced a decline in GDP per capita since 2010. It is the only one of the countries considered below for which the IMF predicts that per capita income will continue to fall.

Codera’s Banking Dashboard
Codera has launched a South African Banking Dashboard, which provides updated access to over 300 accounting line items for South African banks and additional custom indicators developed by Codera. The dashboard makes it easy for analysts to access and analyse hundreds of different measures of banks’ financial position, that in turn indicate bank performance and broader financial stability risk. Users …
Long term value of the rand
Before 1982, the rand was worth more than the US dollar. Since then, the rand has depreciated relative to the dollar at an average of over 8% per year. After being triggered by political pressure and sanctions, depreciation gained momentum as a result of a divergence in inflation in South Africa and major economies (see second chart). The difference between …
Codera’s Guide to Learning R
Are you looking to dive into the exciting world of data analysis but have no prior experience with R? Our beginner-friendly guide will take you step-by-step through the process of learning R programming. Discover the power of R for data handling, analysis, and visualization, even if you have never coded in R before. Over the next several months, Codera will …
The Harvard Growth Lab on why South Africa is stagnating
The Harvard Growth Lab published a paper asking why ‘three decades after the end of apartheid, the economy is defined by stagnation and exclusion, and current strategies are not achieving inclusion and empowerment in practice’. The authors suggests this reflects collapsing state capability. The report points to a lack of meritocracy in public appointments, counterproductive ideologically-driven policies and active discouragement …
Real yield curves for selected EMEs
South Africa’s yield curve is very steep compared to other emerging market economies. The chart below adjusts sovereign bond yield curves by current inflation to compare the levels of long-term real yields. Brazil and Mexico, by way of example, currently have higher real interest rates at short maturities than South Africa, but South Africa’s real yields are higher at longer …
PPP implied valuation of the ZAR
A rule of thumb when thinking about the long-term fundamental fair value of a currency is that you will get as many different estimates as the number of models you use. But that does not mean that models are not useful. Different models are useful for different purposes and help to shed led light on how drivers of currency movements …
Taxpayers and tax receipts in SA
The most recently published tax statistics for South Africa show that there were around 275 000 taxpayers who earned over R1million in 2020. This group represented under 2% of taxpayers and contributed over 35% of the total personal tax take. South Africa’s tax system is highly progressive: roughly 110 000 people (around 0.7% of taxpayers) who earned over R1.5 million …


