Today’s blog post is an unedited version of our Business Day article.

The South African Reserve Bank, like many other central banks, publishes a ‘fan chart’ to communicate uncertainty around its projected policy rate path. Fan charts are published to anchor expectations around single line forecasts while illustrating that future policy rate settings depend on unpredictable shocks that will hit the economy in future. The wider the range around a projection, the greater the uncertainty around the bank’s forecasts.
By replacing the hubris of point forecasts with the humility of forecast ranges, fan charts are intended to support policy transparency and accountability. Making it clear that policymaking is based on judgments of the probabilities of specific outcomes and their drivers should help focus monetary policy discussion on a range of scenarios, instead of a single scenario.
But the Reserve Bank’s framework is missing some elements to realise these intensions. Specifically, the Bank does not align how it communicates its policy decisions with the projections it publishes or quantify how it weighs competing risks to its projections.
The Reserve Bank sets its policy rate based on votes from Monetary Policy Committee (MPC) members who have their own personal views of how the economy works or the balance of different risks that face the economy at any point in time. The Reserve Bank’s projections and fan chart, on the other hand, come from a model which does not incorporate any risk assessment and assumes an economic narrative about the future that may differ from what MPC members themselves have in mind when they vote. This has meant that SARB’s policy rate setting decisions sometimes diverge from the policy rate forecasts that it publishes when the policy rate is set. As we have argued previously in this newspaper, this undermines the credibility of the Bank’s projections.
One remedy would be to formally explain how MPC members’ views about the outlook differ from what has been assumed in the Bank’s forecasts. Alternatively, the Bank could align its projections with the collective view of the MPC members, as is done by some leading central banks such as the Bank of England.
But there would still exist a tension between the subjective judgements of MPC members and those of forecasters who construct Bank projections. The good news is that advances in modelling have made it easier not only to present alternative macroeconomic scenarios and their drivers, but also to quantify the extent of uncertainty around projections. One can, for example, estimate the risk balance for specific asset prices such as the exchange rate or oil price using market pricing, estimate the likelihood of specific outcomes from specific models, or track the assumptions that have contributed to forecast errors.
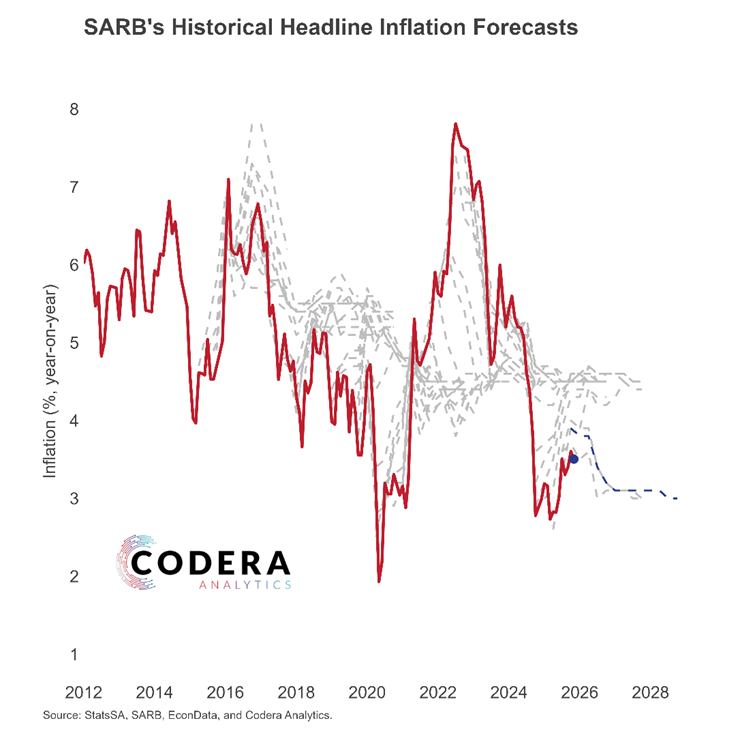
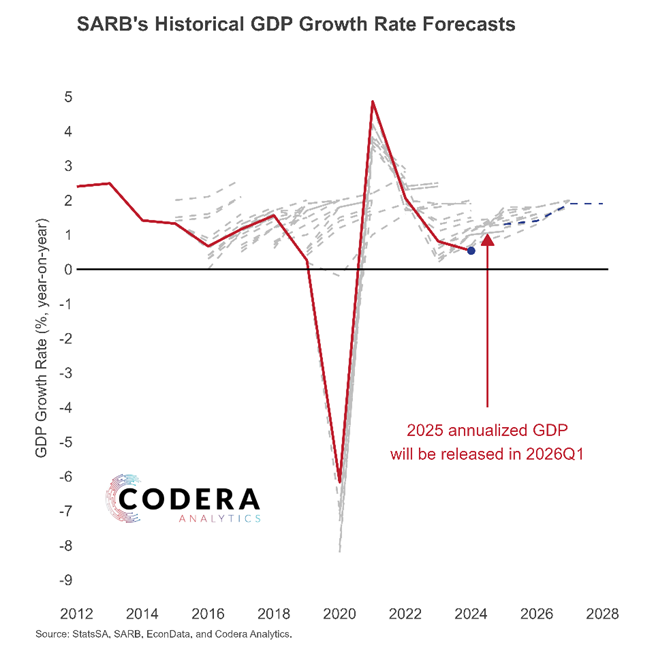
While the MPC has previously asserted that it is ‘data-dependent’ in its decision-making, it is also not clear the extent to which the same is true of their model. The Bank’s forecasts errors have been systematically related over time, with large same-direction errors for GDP and inflation over consecutive forecasts. This means that its forecasters have taken a long time to incorporate new information once they see that their projections have been unduly optimistic or pessimistic.
In its most recent projections, the Reserve Bank estimates that the policy rate could range between about 3.2% and 8.9% over the next three years. This does not encompass the historical policy rate range since the adoption of inflation targeting in 2000, which was between 3.5% and 13.5%. The Bank assumes that components of inflation, such as food and fuel, will be permanently lower after the adoption of a lower inflation target than historically the case. We will have to wait and see whether the SARB will be correct in this judgement as it is too early to tell whether the statistical likelihood of different outcomes has changed.
To the Reserve Bank’s credit, it has started publishing some information on the scenarios it considered when policy decisions were made. But it does not consistently publish data on precisely what these scenarios involve or describe their underlying economic drivers. Without this, it is difficult to understand whether the Bank’s various projections are economically coherent, and of limited use for scenario planning by firms and market analysts.
From a statistical perspective, the probability that any specific central bank scenario occurring exactly as published, including its ‘baseline projections’, is effectively zero. These projections are instead useful as a benchmark for scenario analysis that help communicate how the central bank would respond should specific shocks eventuate.
It is therefore encouraging that the Bank has begun to incorporate scenario analysis into its policy process. But if the Bank avoids greater transparency because it fears revealing weaknesses in its models or the possibility of being wrong, then the continued publication of a policy fan chart is hard to justify.
In line with the proposals of former US Federal Reserve chair Ben Bernanke to the Bank of England, it is time to replace fan charts with forecast scenario driver analysis and detailed balance of risk assessments. This would promote a risk management approach to monetary policy and help the public better understand its policy settings.
Dr Steenkamp is CEO at Codera Analytics and a research associate with the Economics Department at Stellenbosch University.