Most inflation targeting central banks look not just at headline inflation, but also analyse persistent components of consumer inflation by estimating various measures of trend inflation. In this post I use approach of Eo et al. (2023, forthcoming in Journal of Applied Econometrics) to assess the contribution of goods and services to changes in underlying inflation in South Africa.
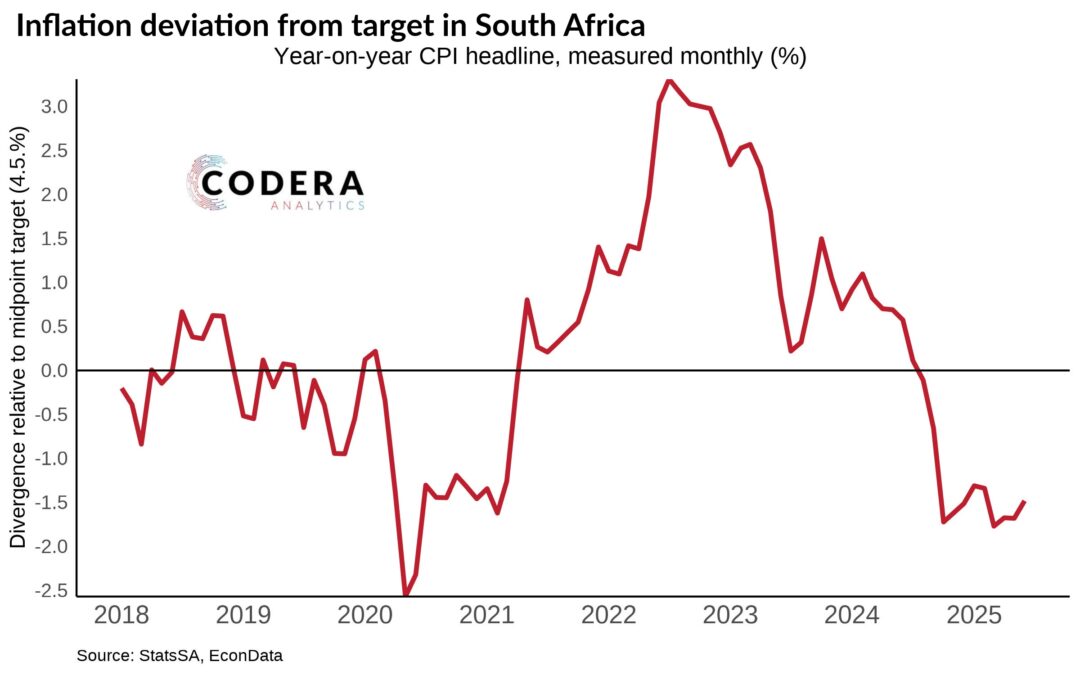
The estimated trend measure removes transitory noise from each inflation series to obtain a measure of ‘underlying’ inflation. These estimates suggest that underlying inflation picked up to above the inflation target after the COVID-19 pandemic. Though it has fallen back slightly from its mid-2022 highs, aggregate trend inflation is still estimated to be above the midpoint of the inflation target currently.

Like the US estimates from Eo et al. (2023), the trend level of goods inflation fell meaningfully during the 1990s, in part a reflection of the impact of East Asian manufacturing production and increased globalisation. The trend estimates obtained for South African consumer prices are much more volatile compared to the US private consumption expenditure deflators used by Eo et al. (2023), particularly for goods inflation. The dynamics of inflation in South Africa has also changed less than in the US, where services inflation declined less than goods inflation and the weight of services in aggregate prices has risen more. As a result, the overall picture is the reverse of what has been observed in the US recently, with the model suggesting that goods inflation has driven the volatility of aggregate trend inflation in South Africa since the global financial crisis. Even though inflation volatility has declined dramatically, it remains at levels currently that are comparable to what advanced economies experienced in the 1990s. Lastly, inflation is also much more persistent than the estimates for the US from Eo et al. (2023) suggest, particularly services inflation.

The chart below shows the gap between trends in goods and services inflation. Whereas the gap is estimated by Eo et al. (2023) to be negative for the US, it has been positive on average in South Africa’s case and has widened by more than in the US. A growing gap likely has implications for South Africa’s optimal inflation rate (or appropriate inflation target) since inflation dispersion affects welfare (Wolman 2011).

The academic literature suggests that an inflation targeter facing sectoral heterogeneity in inflation rates and/or inflation persistence should put more weight on controlling inflation in the sector with the greatest distortions or the least flexible prices. This normally would be categories of goods and services whose prices are domestically-determined (e.g. non-tradable inflation). But in a South African context, a large proportion of our high structural inflation owes to high administered price and government-related inflation. Since the central bank cannot directly affect prices in such categories, reacting to first-round price pressures in such inflexible price categories risks creating worse inflation volatility/price dispersion.
A final technical point is worth emphasizing. To understand the implications of relative price shocks such as the ones we have been observing for the appropriate setting of monetary policy, a measure of core inflation should be used in models. This is indeed the case in the QPM forecasting model used by SARB, which allows for the headline CPI to be explicitly decomposed into its non-core and core subcomponents. Since underlying inflation is an unobservable concept, it needs to estimated and the policy implications of using different measures of underlying inflation continuously evaluated. The estimates presented here, along with alternative core estimates such as the ones I summarised recently, show a fair bit of divergence over recent years. Which measure is best to use to inform monetary policy is partly an empirical question, requiring assessment, for example, of how well a given measure forecasts future trend inflation.
Footnotes
Note that I backdated the goods and services CPI series using StatsSA data and constructed a time series of official historical weights of each component back to 19070. I used Eo et al. (2023)’s code, available here. Estimates at a quarterly and monthly frequency were broadly similar but I chose to keep to a quarterly frequency for comparability to the original paper. I did not update the priors of the model, but this might be worth investigating.
It is also important to point out that the goods and services categories used may not necessarily be good proxies of tradable and non-tradable inflation since both categories will include intermediate inputs from the other sector and the share of tradable components will vary over time. Developing indicators of tradable and non-tradable prices (as we did in some earlier research) would enhance our understanding of what these price dynamics mean from a macroeconomic perspective.
Our measure of common price changes across categories in the CPI basket has recently been slightly higher than the measure that excludes food, NAB, fuel and energy, suggesting that there has been more broad-based inflation pressure than that alternative measure of core inflation has implied.