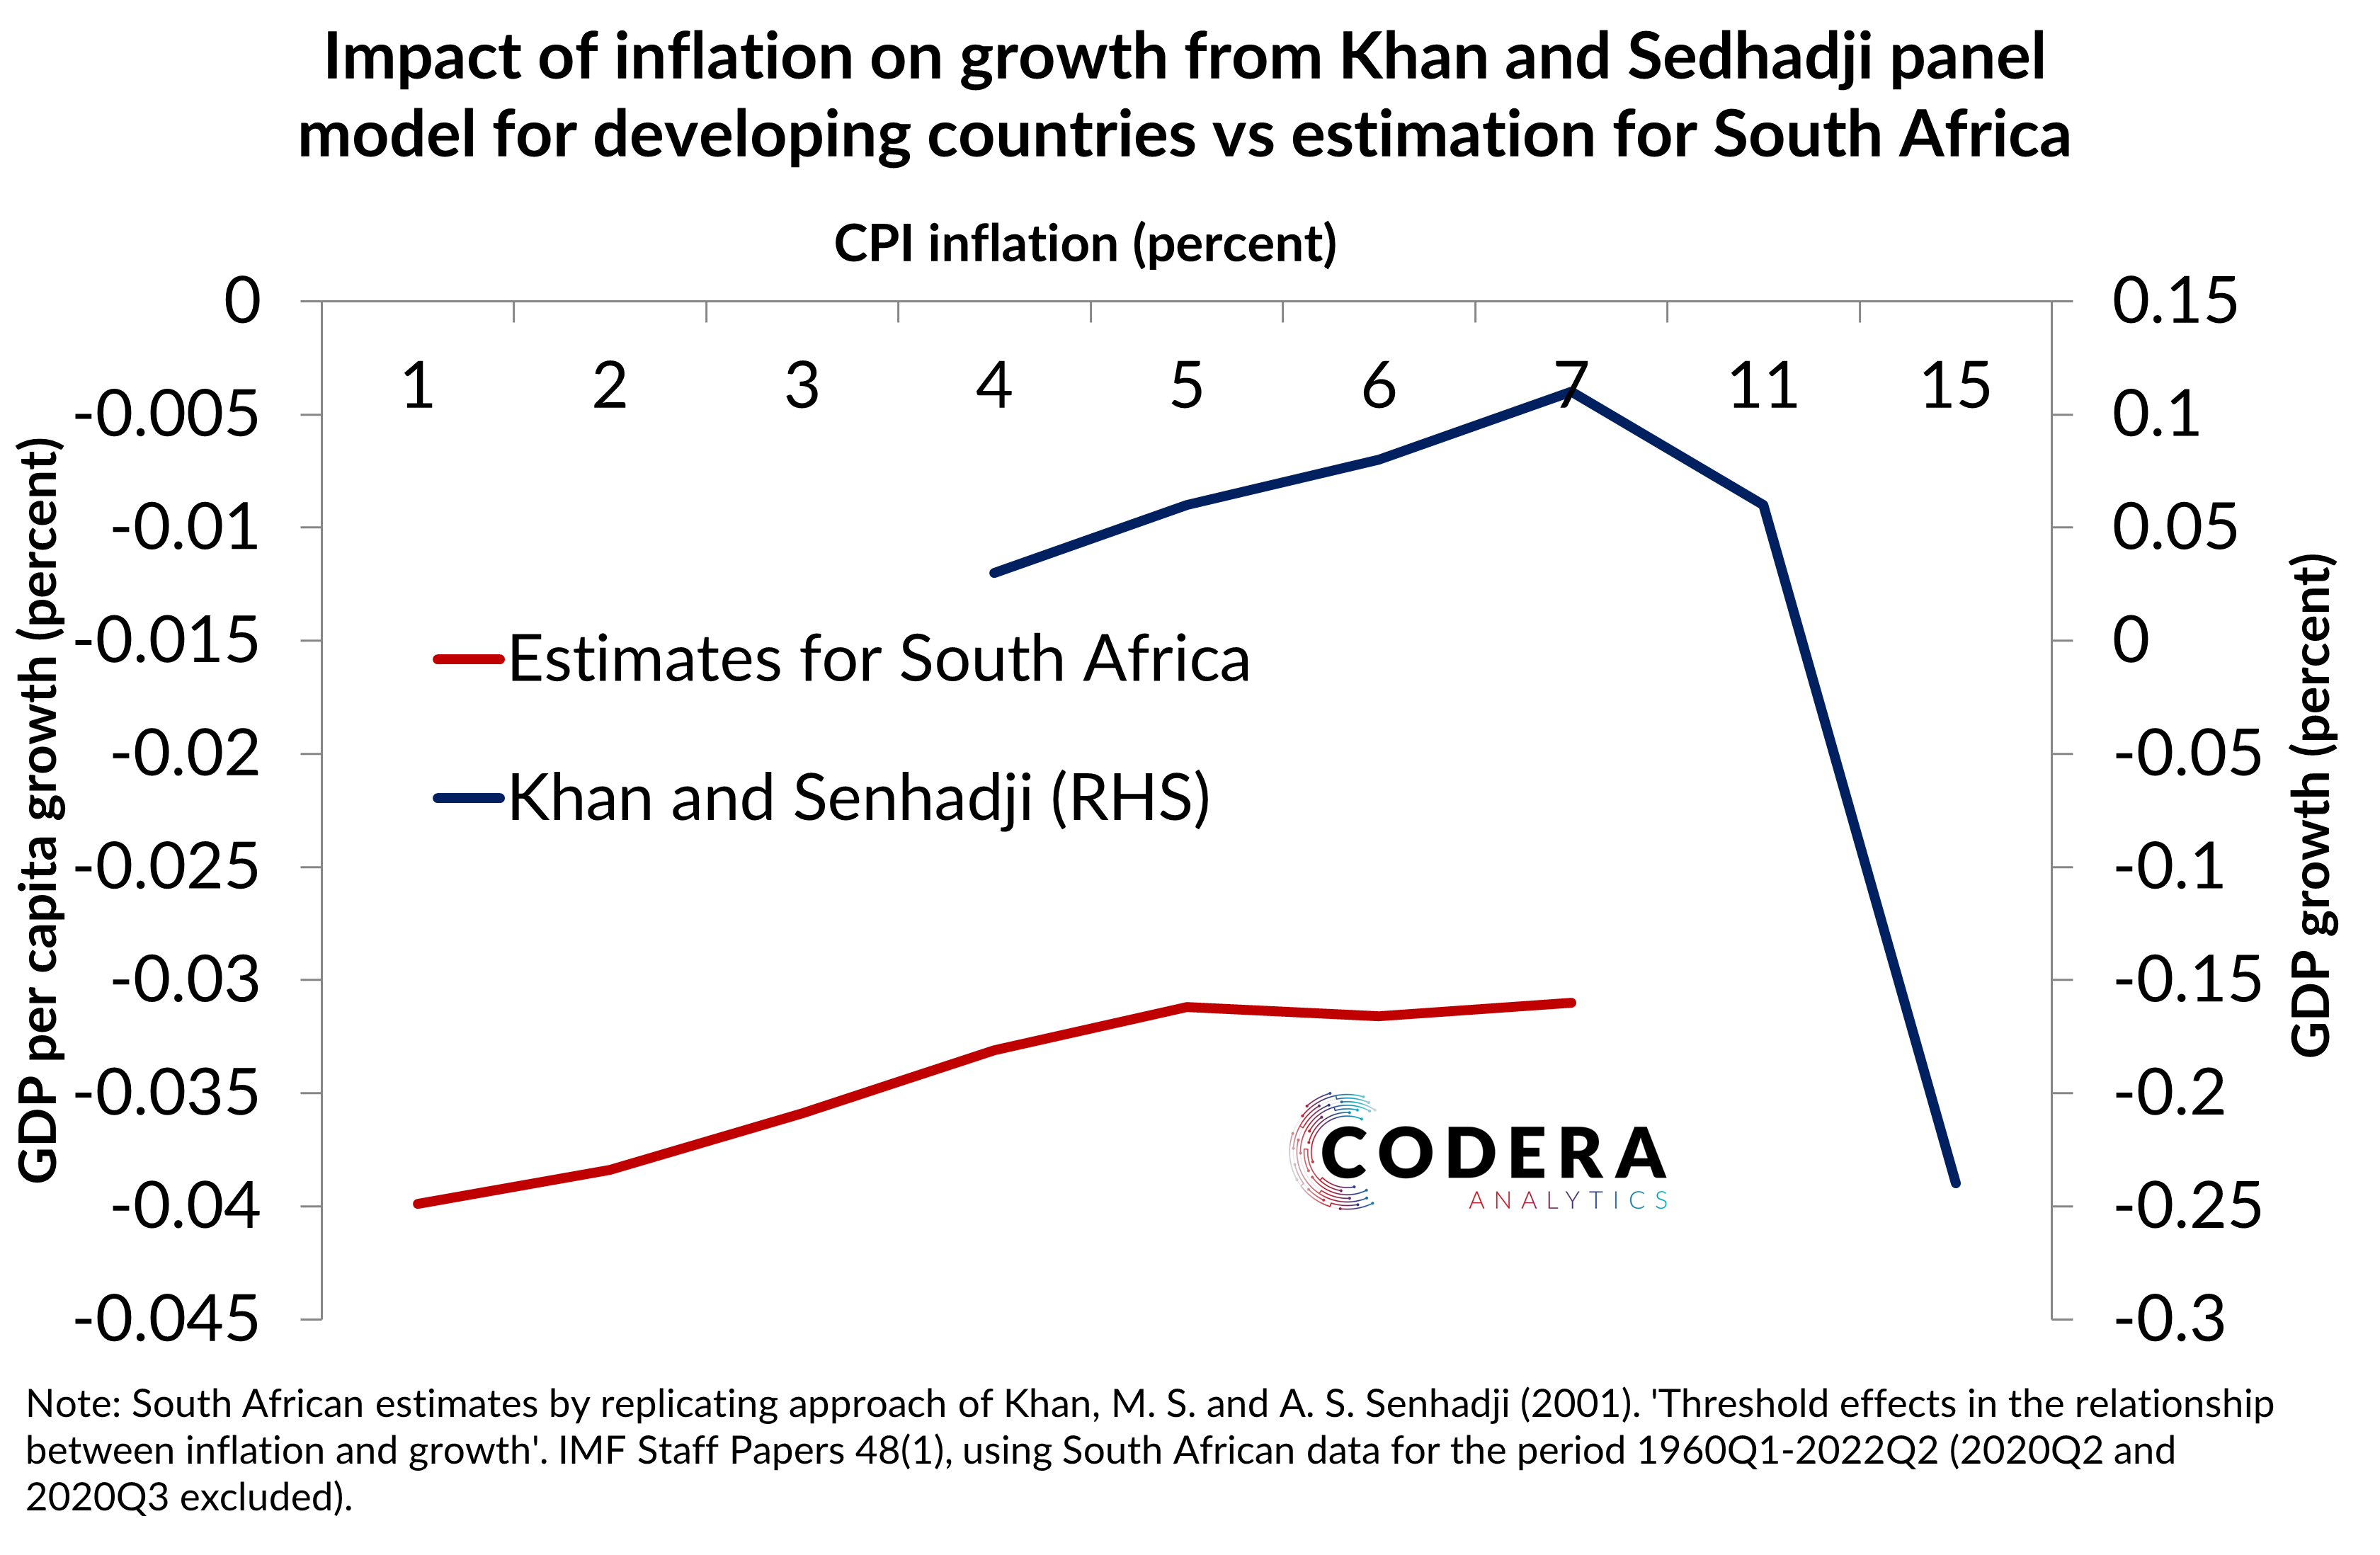
There is a perception among some commentators that higher economic growth could be achieved if higher inflation is tolerated. An IMF paper by Khan and Senhadji is often cited in support of such a contention. Khan and Senhadji (2001) suggest that the relationship between inflation and growth is positive at lower inflation rates, but growth slows in advanced economies above inflation of between 1 to 3 percent, and above 7 to 11 percent for developing economies. In the figure below, I replicate the Khan and Senhadji approach for South African data. It shows that the relationship is negative irrespective of the level of inflation. This implies that economic growth has not been sustainably boosted by tolerating a higher rate of inflation.
Footnotes
- Note that Khan and Senhadji (2001) apply a threshold model to 5 year averages of data for a panel of 140 countries over the sample 1960-1998. I estimate the following model using quarterly South African data:
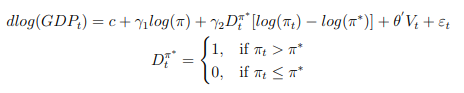 where GDP is measured as GDP per capita, πt is CPI inflation in year-on-year terms, X∗ is the threshold level of inflation, Dt is a dummy variable that takes the value of one when inflation is above a given inflation threshold or zero otherwise and Vt is a vector of possible control variables, including growth in investment, and the growth rate of terms of trade including gold. All variables are measured to be consistent with the approach of Khan and Senhadji (2001), with the exception of GDP, where GDP per capita is used since GDP growth is non-stationary even when expressed in log difference terms and investment which is specified in growth terms instead of a ratio to GDP.
2. The result described holds at higher levels of inflation than shown on the chart (e.g. levels above 10 percent) and is invariant to the inclusion of control variables like investment growth and terms of trade.
3. The qualitative results are robust of the transformation used for CPI, the sample period used (i.e. the inflation targeting period post 2000), the measure of inflation used and the number of regimes used in estimation.
4. It is worth noting that using a pre-COVID-19 sample (before GDP data were revised to be higher) produces estimates of growth costs that are higher at higher levels of inflation for South Africa, suggesting that lower inflation would tend to be associated with a lower growth drag from inflation distortions.
5. In a future post I will use a structural model to show whether controlling for various structural shocks that may have impacted this structural relationship, such as supply shocks, oil shocks or political instability, alter the conclusions discussed above.