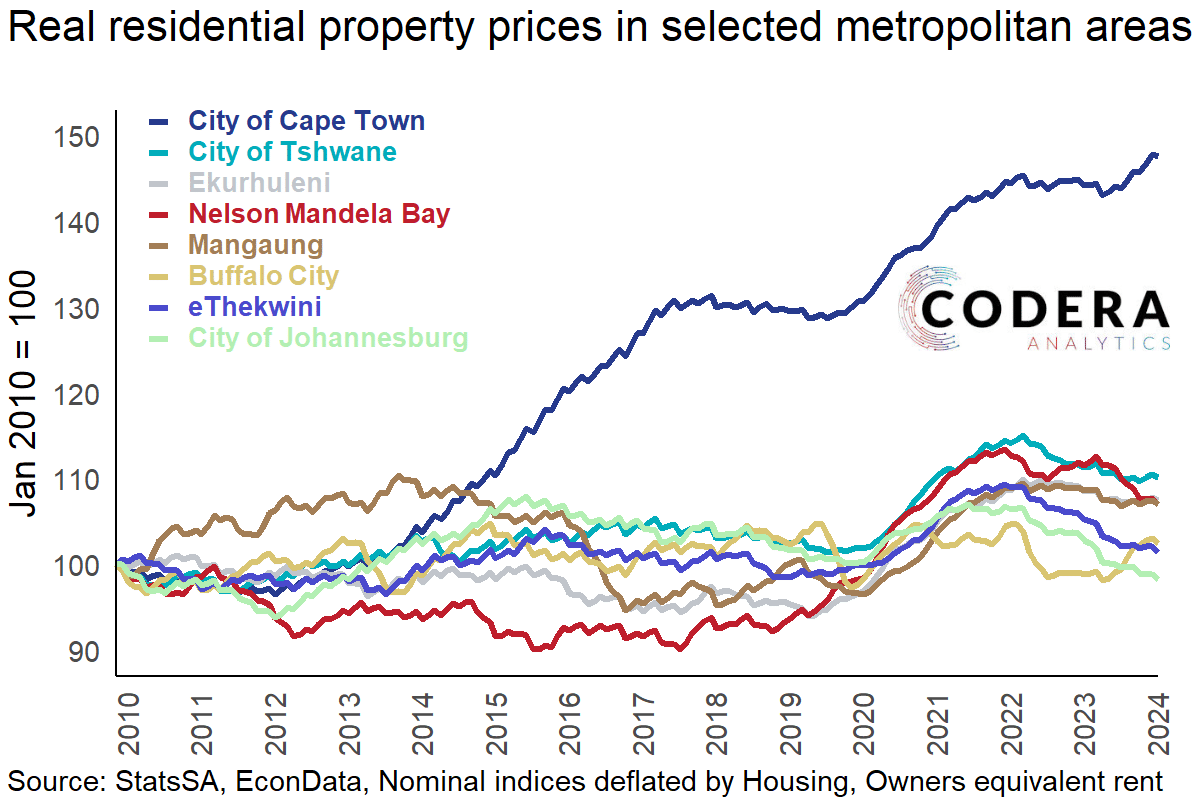
In a previous post, we showed Statistics SA’s estimates suggest that Cape Town is the only major metropolitan area to have recorded real house price increases since 2010. In that post we deflated nominal house price indices using headline consumer prices (CPI). In today’s post, we instead use owners’ occupied rent (an estimate of the cost of housing services for homeowners as if they were renting their own homes) based on the expectation that it would be more directly linked to housing market dynamics. CPI covers a wider range of goods and services prices, which may not necessarily align with housing market trends. One might expect, on the other hand, that owners’ occupied rent might provide a more accurate representation of the connection between property prices and rental markets over time, offering a clearer view of whether property prices are increasing disproportionately compared to rents. This insight is crucial for evaluating potential housing bubbles or issues related to affordability. Property prices have kept rising in Cape Town since the COVID-19 pandemic relative to owners’ occupied rent, whereas real property prices moderated when deflated by CPI. At a provincial level, Northern Cape real property prices rose faster than those in the Western Cape between 2010 and mid-2021, but have been declining since.


Compiled by Almaro De Villiers
Footnote
Note that the indices have been revised relative the experimental series Stats SA published in 2023.

