In this post, I look at recent developments in city-level municipal rates, showing that growth in household municipal bills has exceeded Headline CPI by quite some margin.
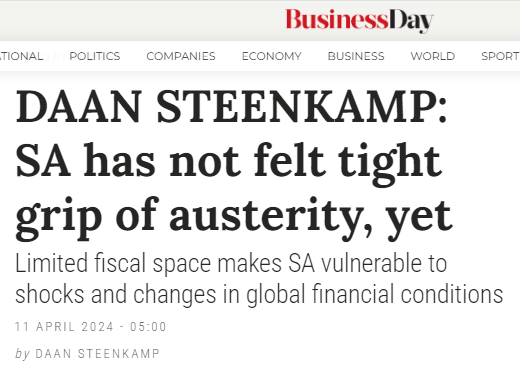
Municipalities levy property rates on the basis of the market values of properties within their jurisdictions. Differences in property rates collected across jurisdictions reflect, among other things, changes in general valuations and the extent of rebates and exemptions provided to households. Property rates have been growing much faster than CPI. Property rates revenue would have risen much more in Johannesburg and Cape Town had the cities not meaningfully raised their zero rated thresholds recently (from R200k in 2016/7 to R350k and R300k in 2020/21, respectively).
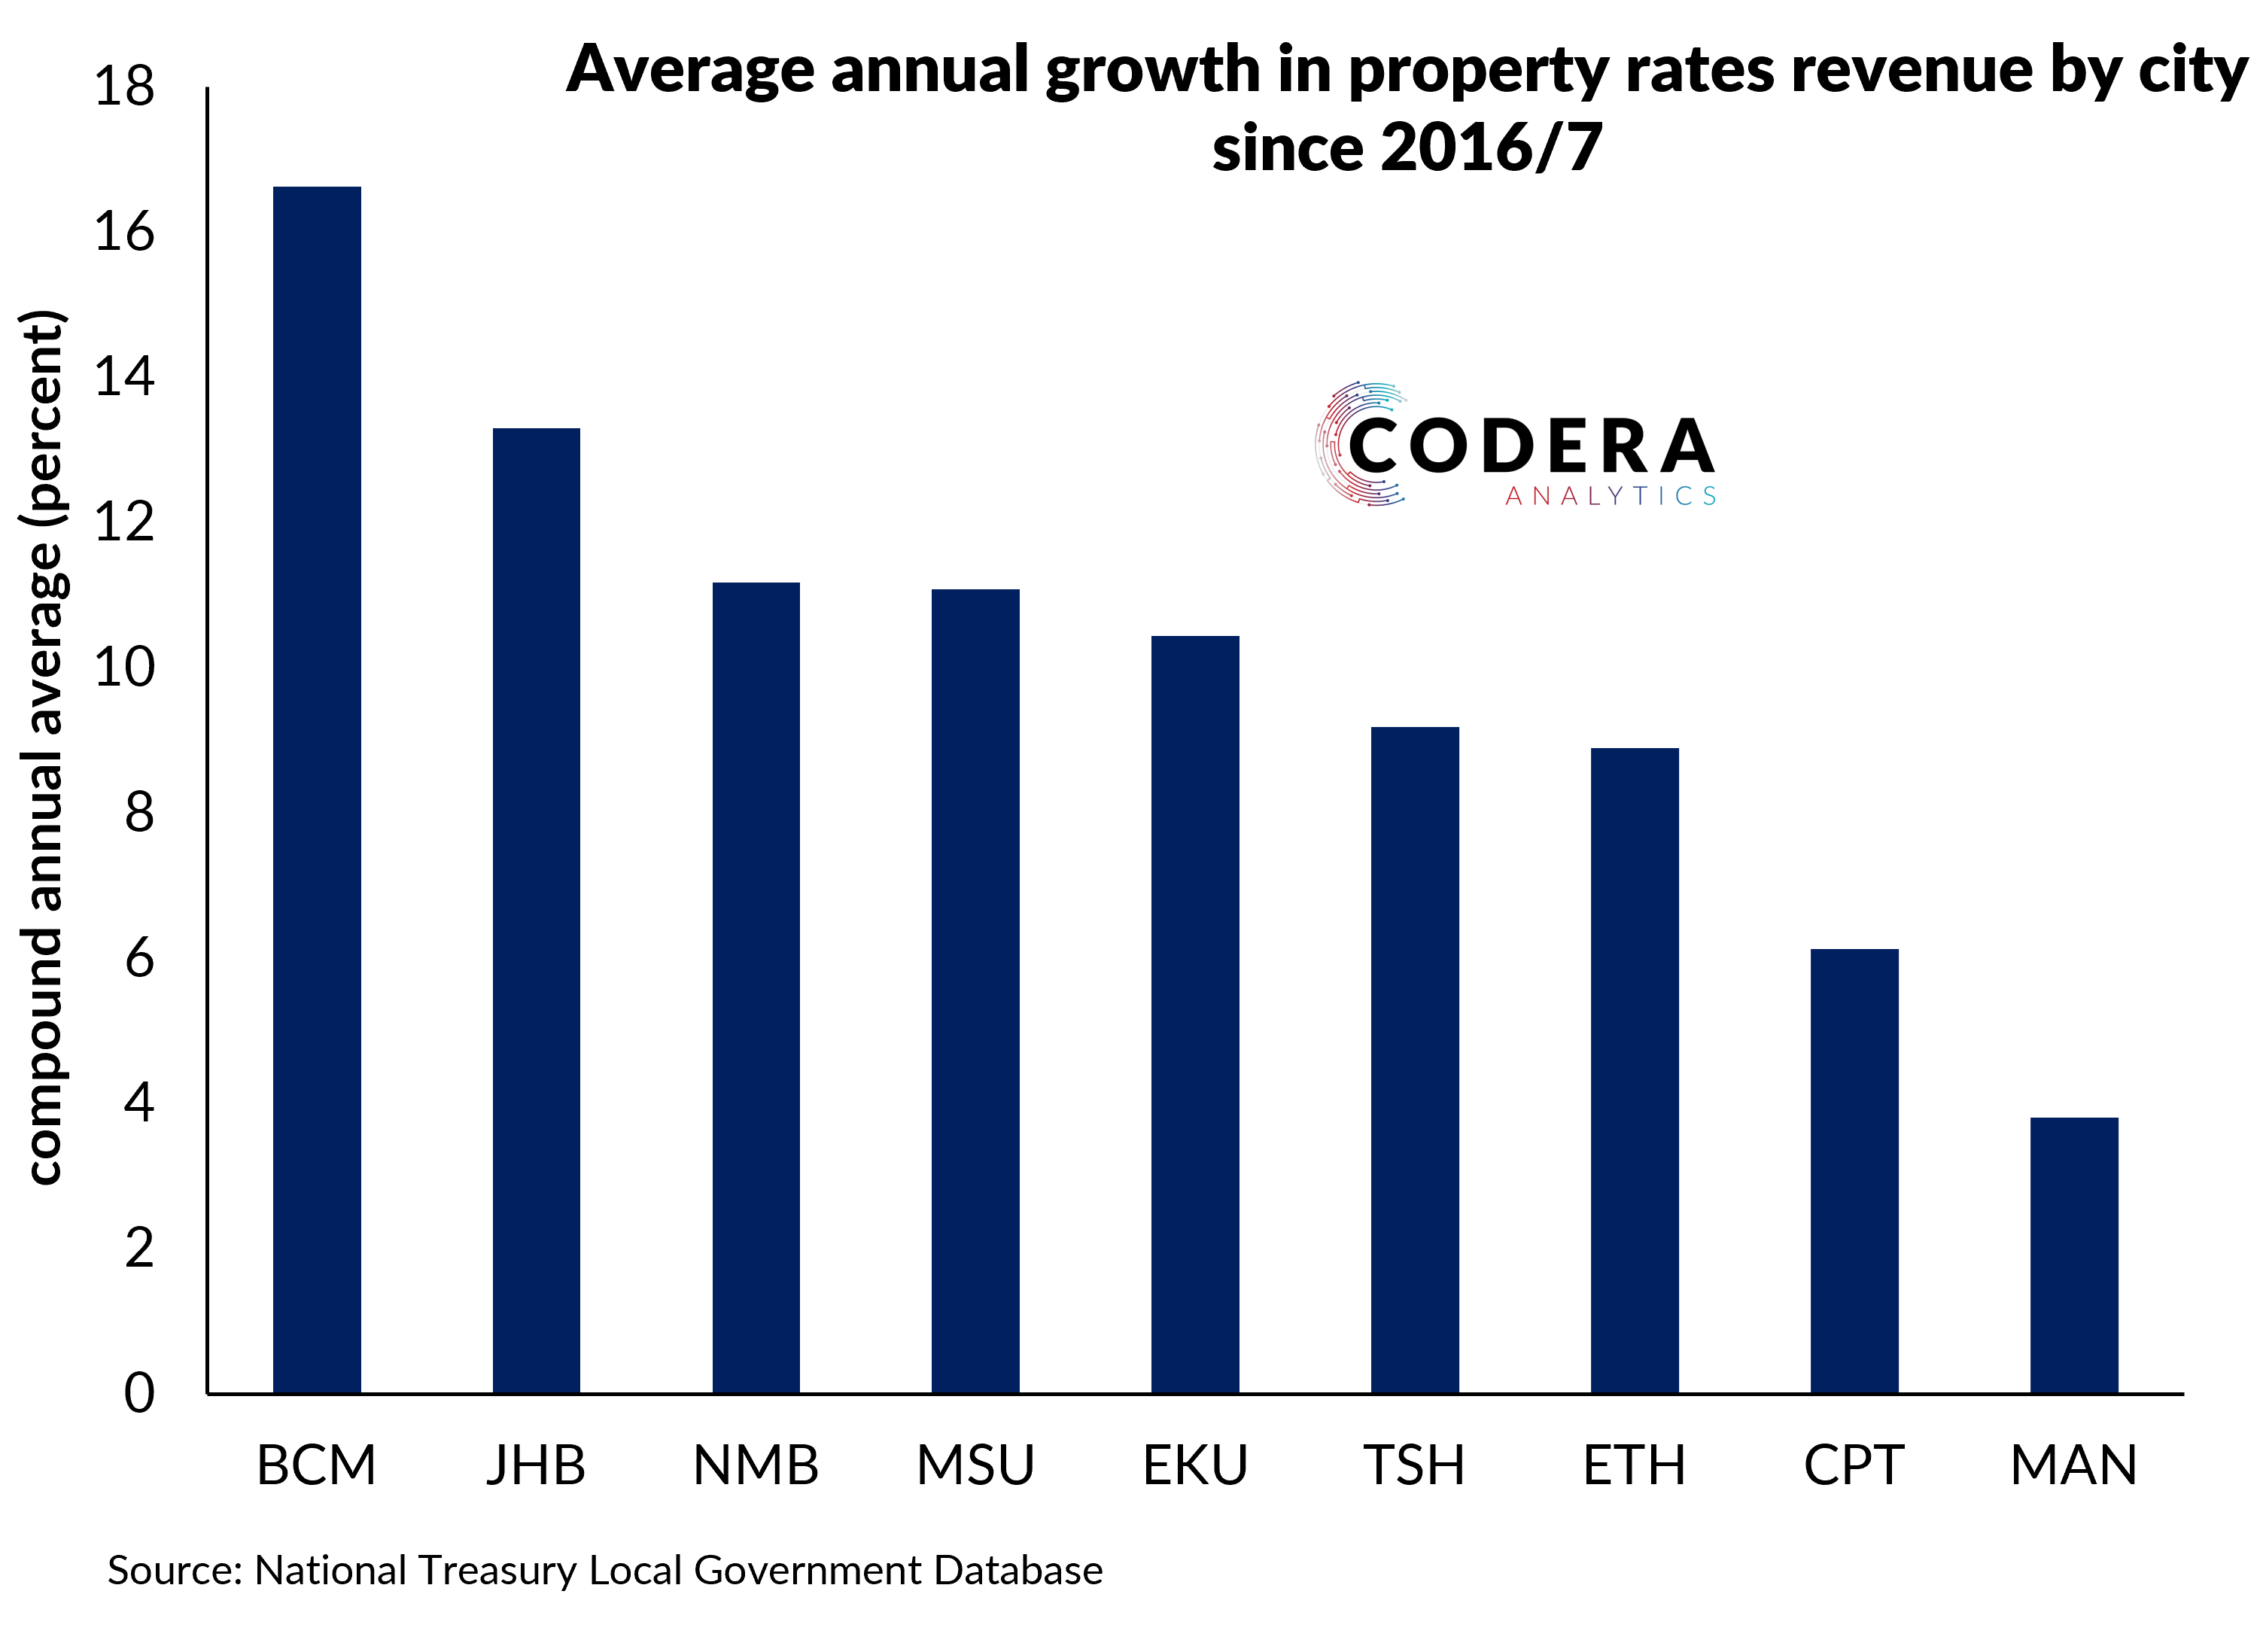
City-level revenues from services charges have grown fastest for water and sanitation. High increases in water charges in Buffalo City and Nelson Mandela Bay reflected restrictions tariffs in response to drought, although Cape Town recorded much lower revenue growth despite large tariff increases. Electricity revenues have growth much slower, owing to low tariff increases allowed by NERSA, load-shedding, consumer’s installing alternative sources of supply and illegal connections and theft.
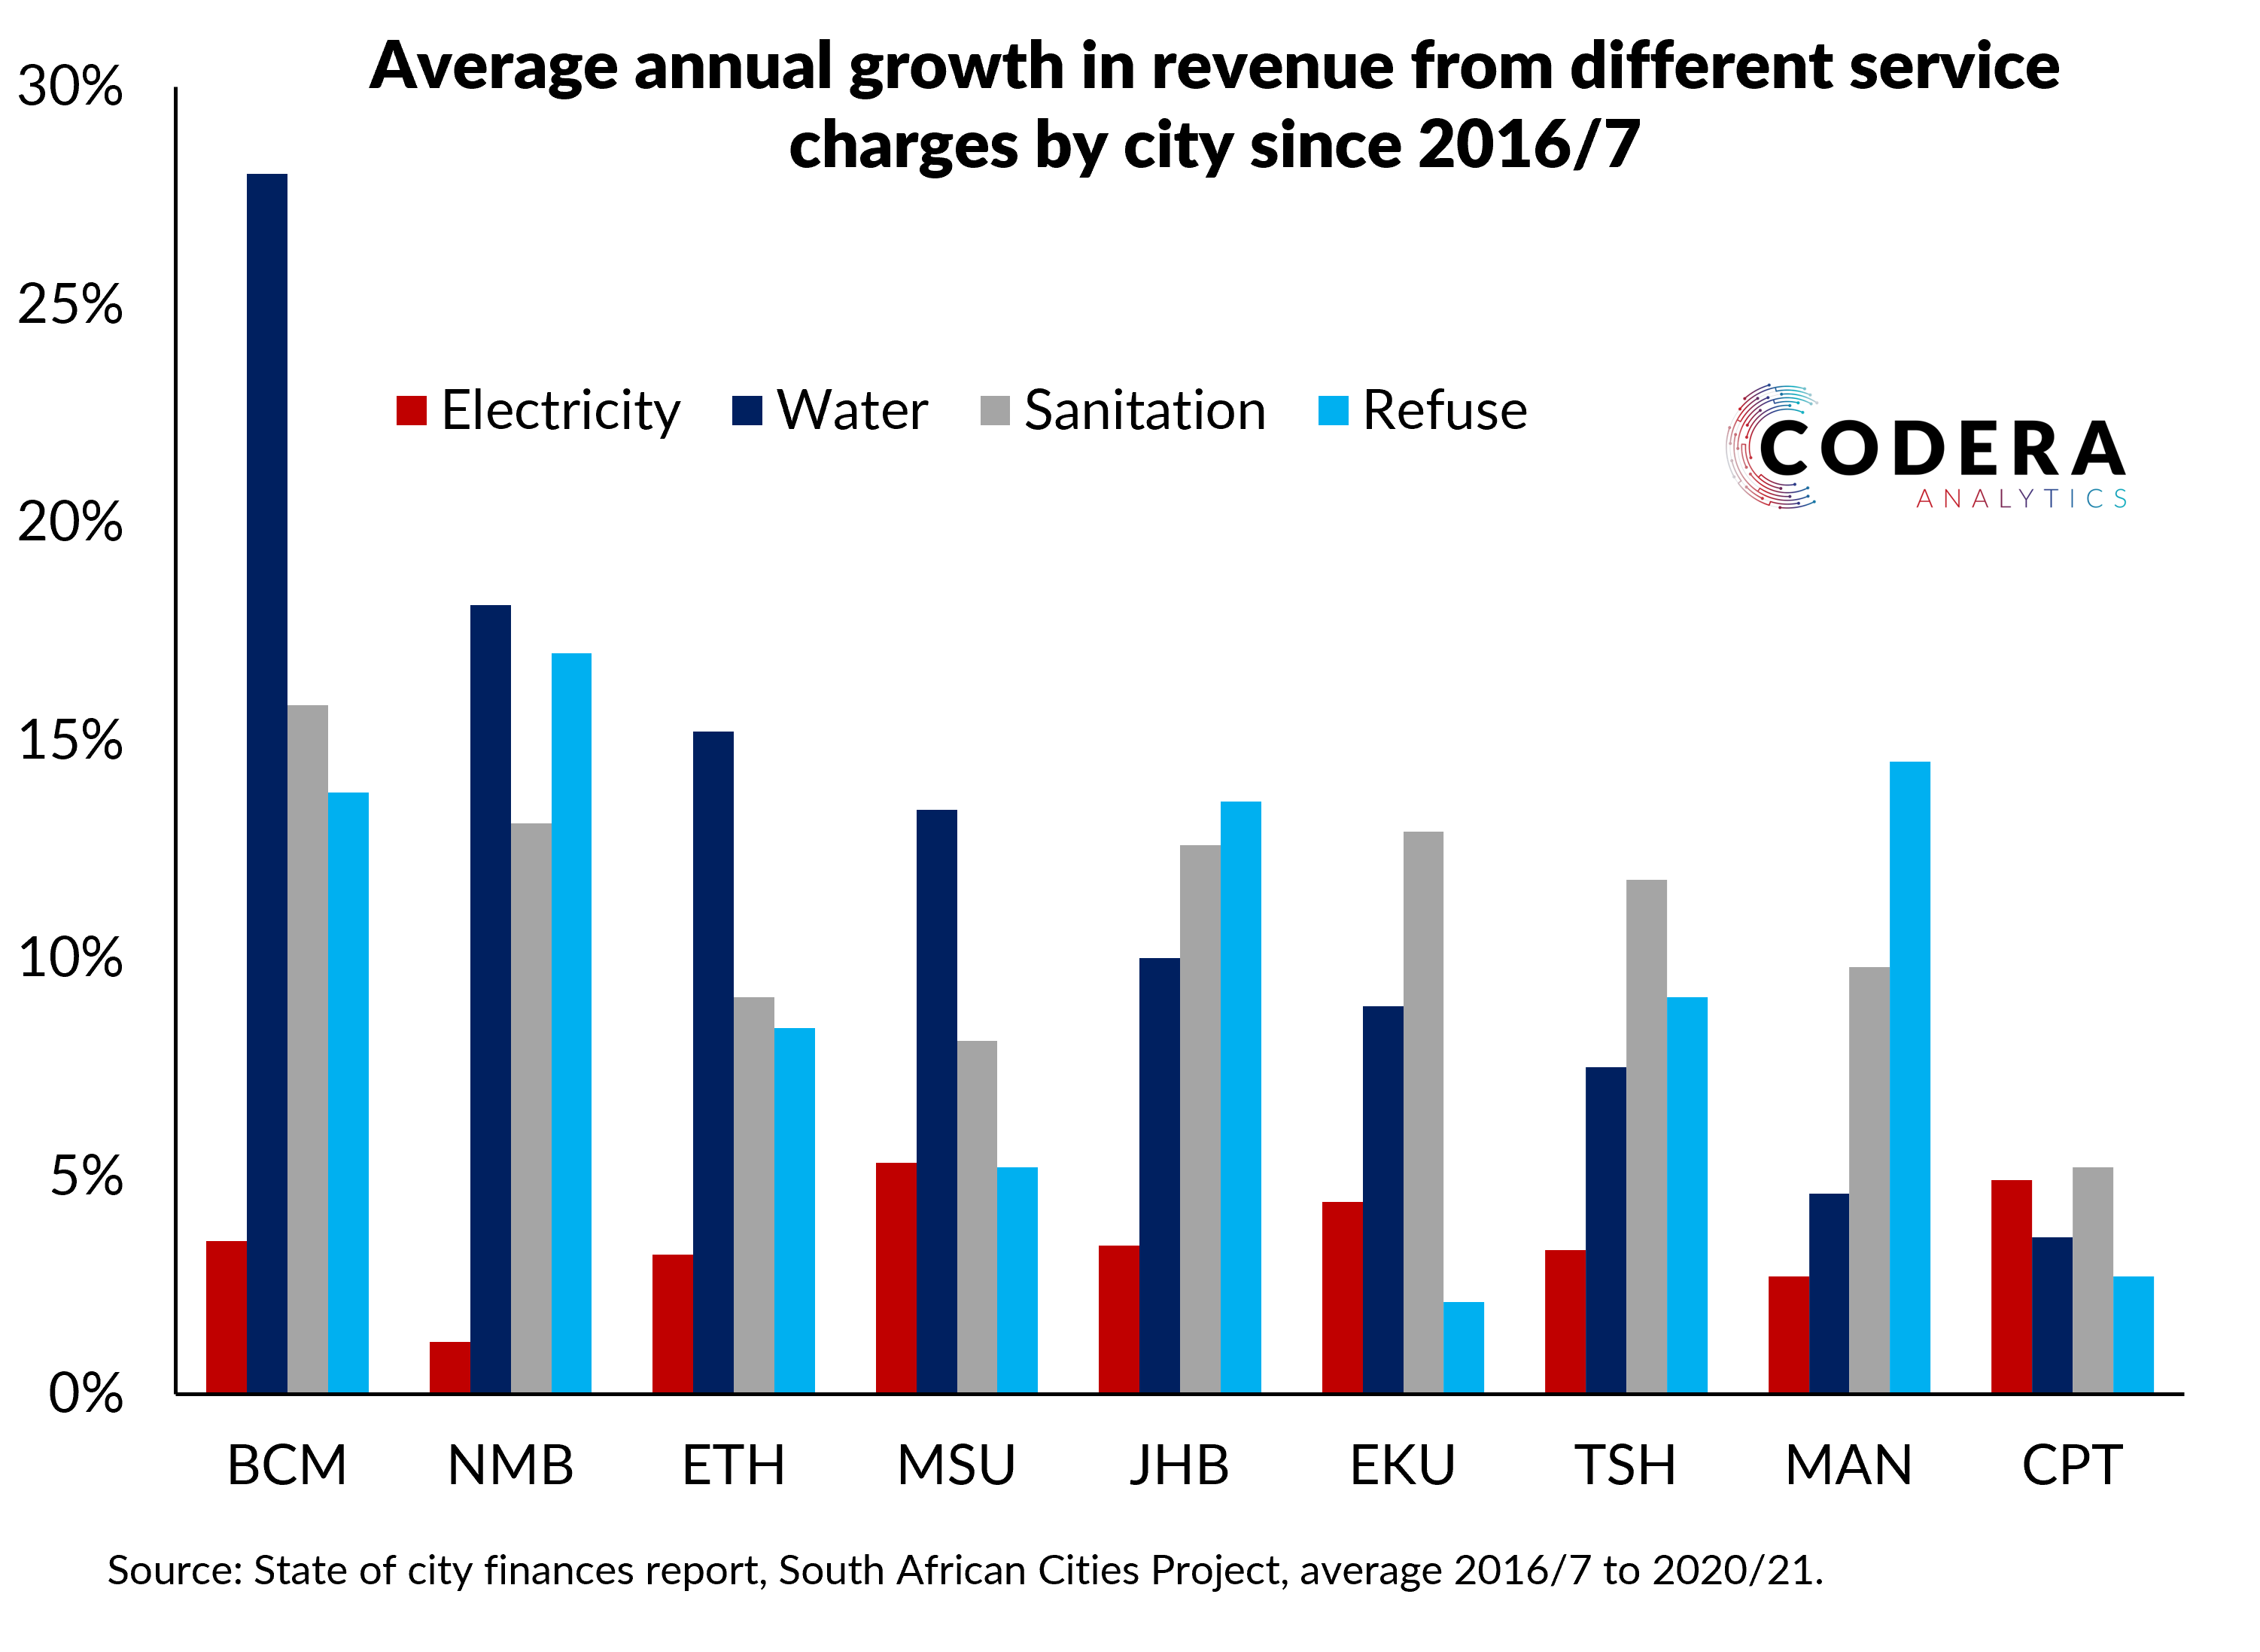
I was surprised to see that estimates presented by the Open Cities Project State of Cities report for 2022 suggest that municipal rates increases have been higher for lower income households than for higher income households. To estimate how the total cost of municipal bills have changed over time one needs to consider how services packages of representative households have changed over time. The SA Cities Project used 2011 Census data to estimate the distribution of household income across cities, which I have labelled as ‘low’ (R3,201−R6,400 in 2011 rands per month) to ‘high’ (R25,601−R51,200) income households in the charts below. The charts below provide their estimates, which suggest that the growth in household municipal bills was much higher than headline CPI and higher for lower income households than for higher income households overall. They also note that (extremely large) negative tariff increases in property rates for low income households in Johannesburg reflected a significant increase in the zero-rated property value and for electricity in Msunduzi for low income households reflected restructuring in their tariff regime.


Footnote
JHB is Johannesburg, CPT is Cape Town, ETH is eThekwini, TSH is
Tshwane, EKU is Ekurhuleni, NMB is Nelson Mandela Bay, BCm is Buffalo City, MAN is Mangaung and MSU is Msunduzi.