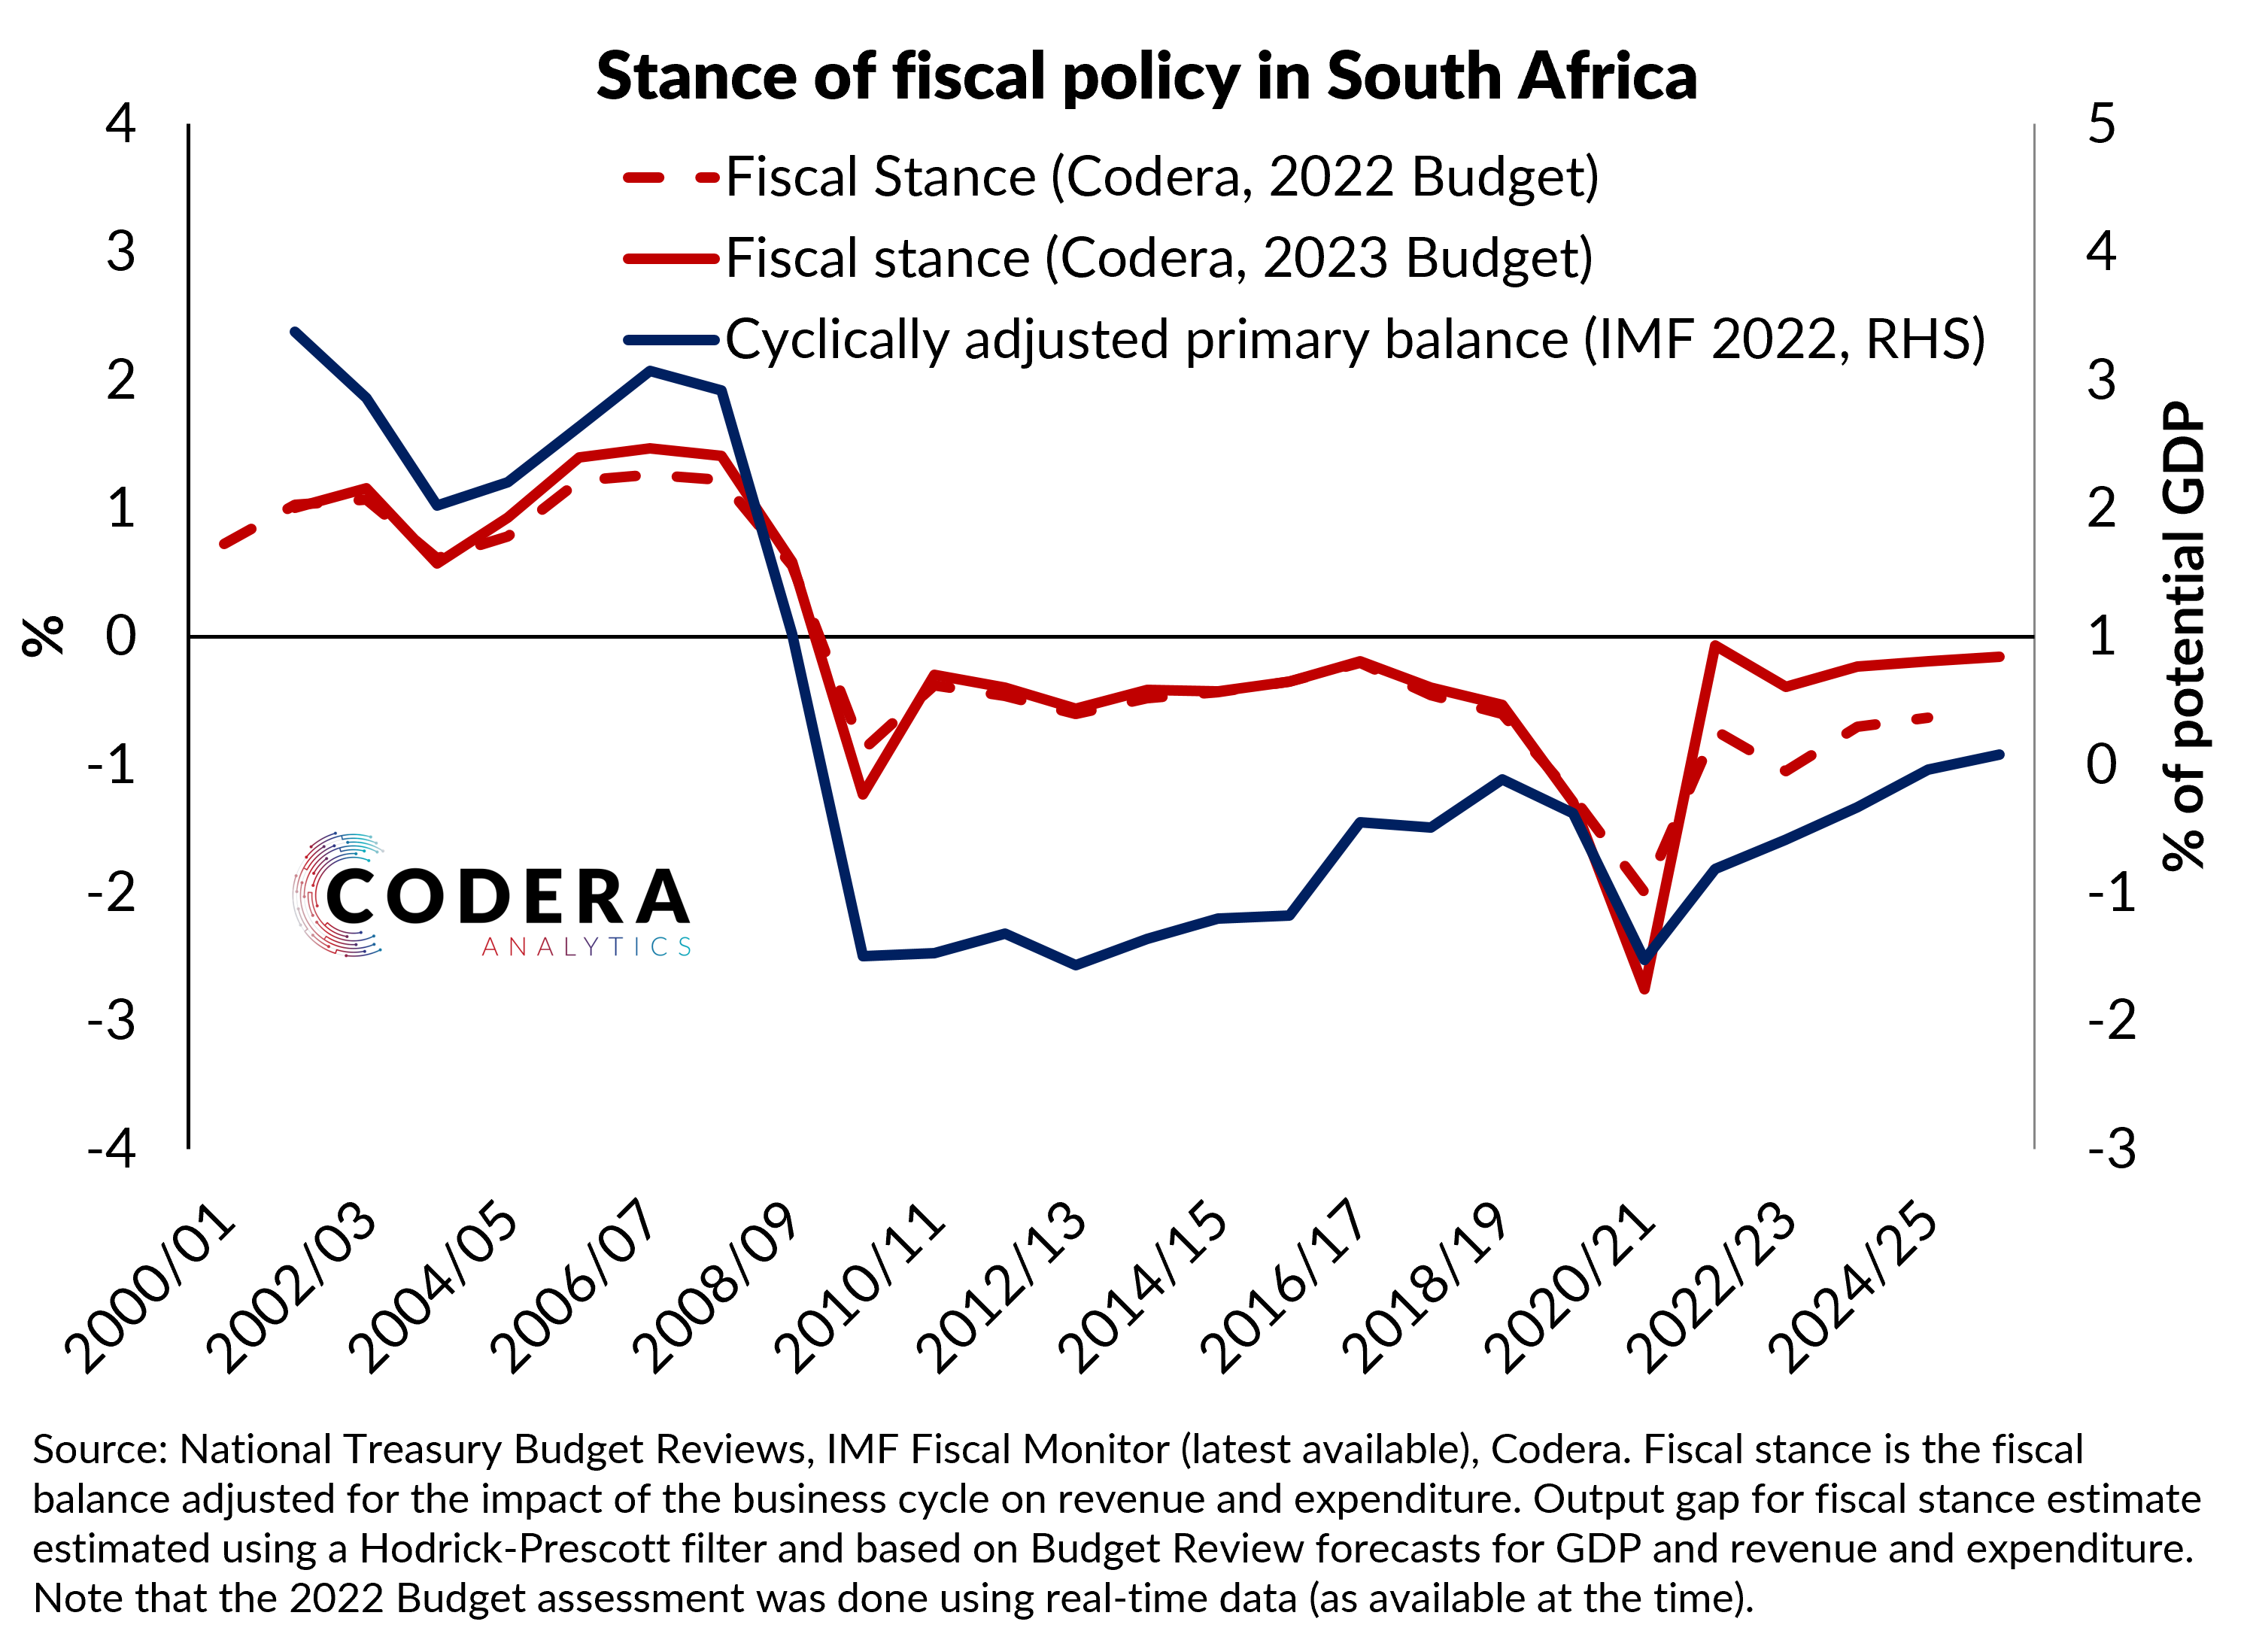
‘Fiscal space’ refers to the extent to which there remains fiscal resources for fiscal policy to respond to unexpected shocks. The chart below calculates an indicator of the cyclical fiscal stance (i.e. fiscal balance adjusted for the impact of the business cycle on revenue and expenditure). Using the Treasury’s projections, I also construct a projection of the cyclical component of expenditure and taxes. The measure suggests that the fiscal stance became less prudent (i.e. more negative) after the Global Financial Crisis (GFC). Whereas fiscal policy was broadly counter-cyclical ahead of the GFC (with the output gap and fiscal stance having the same signs and the fiscal stance being more positive than the output gap), post-GFC fiscal policy eased and remained somewhat easy even as the output gap has narrowed to close to zero.
The IMF measure for South Africa has remained in negative territory since 2009, implying that fiscal policy has stayed ‘loose’ even as the economy began to recover after the GFC and the output gap gradually closed ahead of the COVID-19 crisis. Looking ahead, the IMF assumes fiscal policy will become less stimulative.
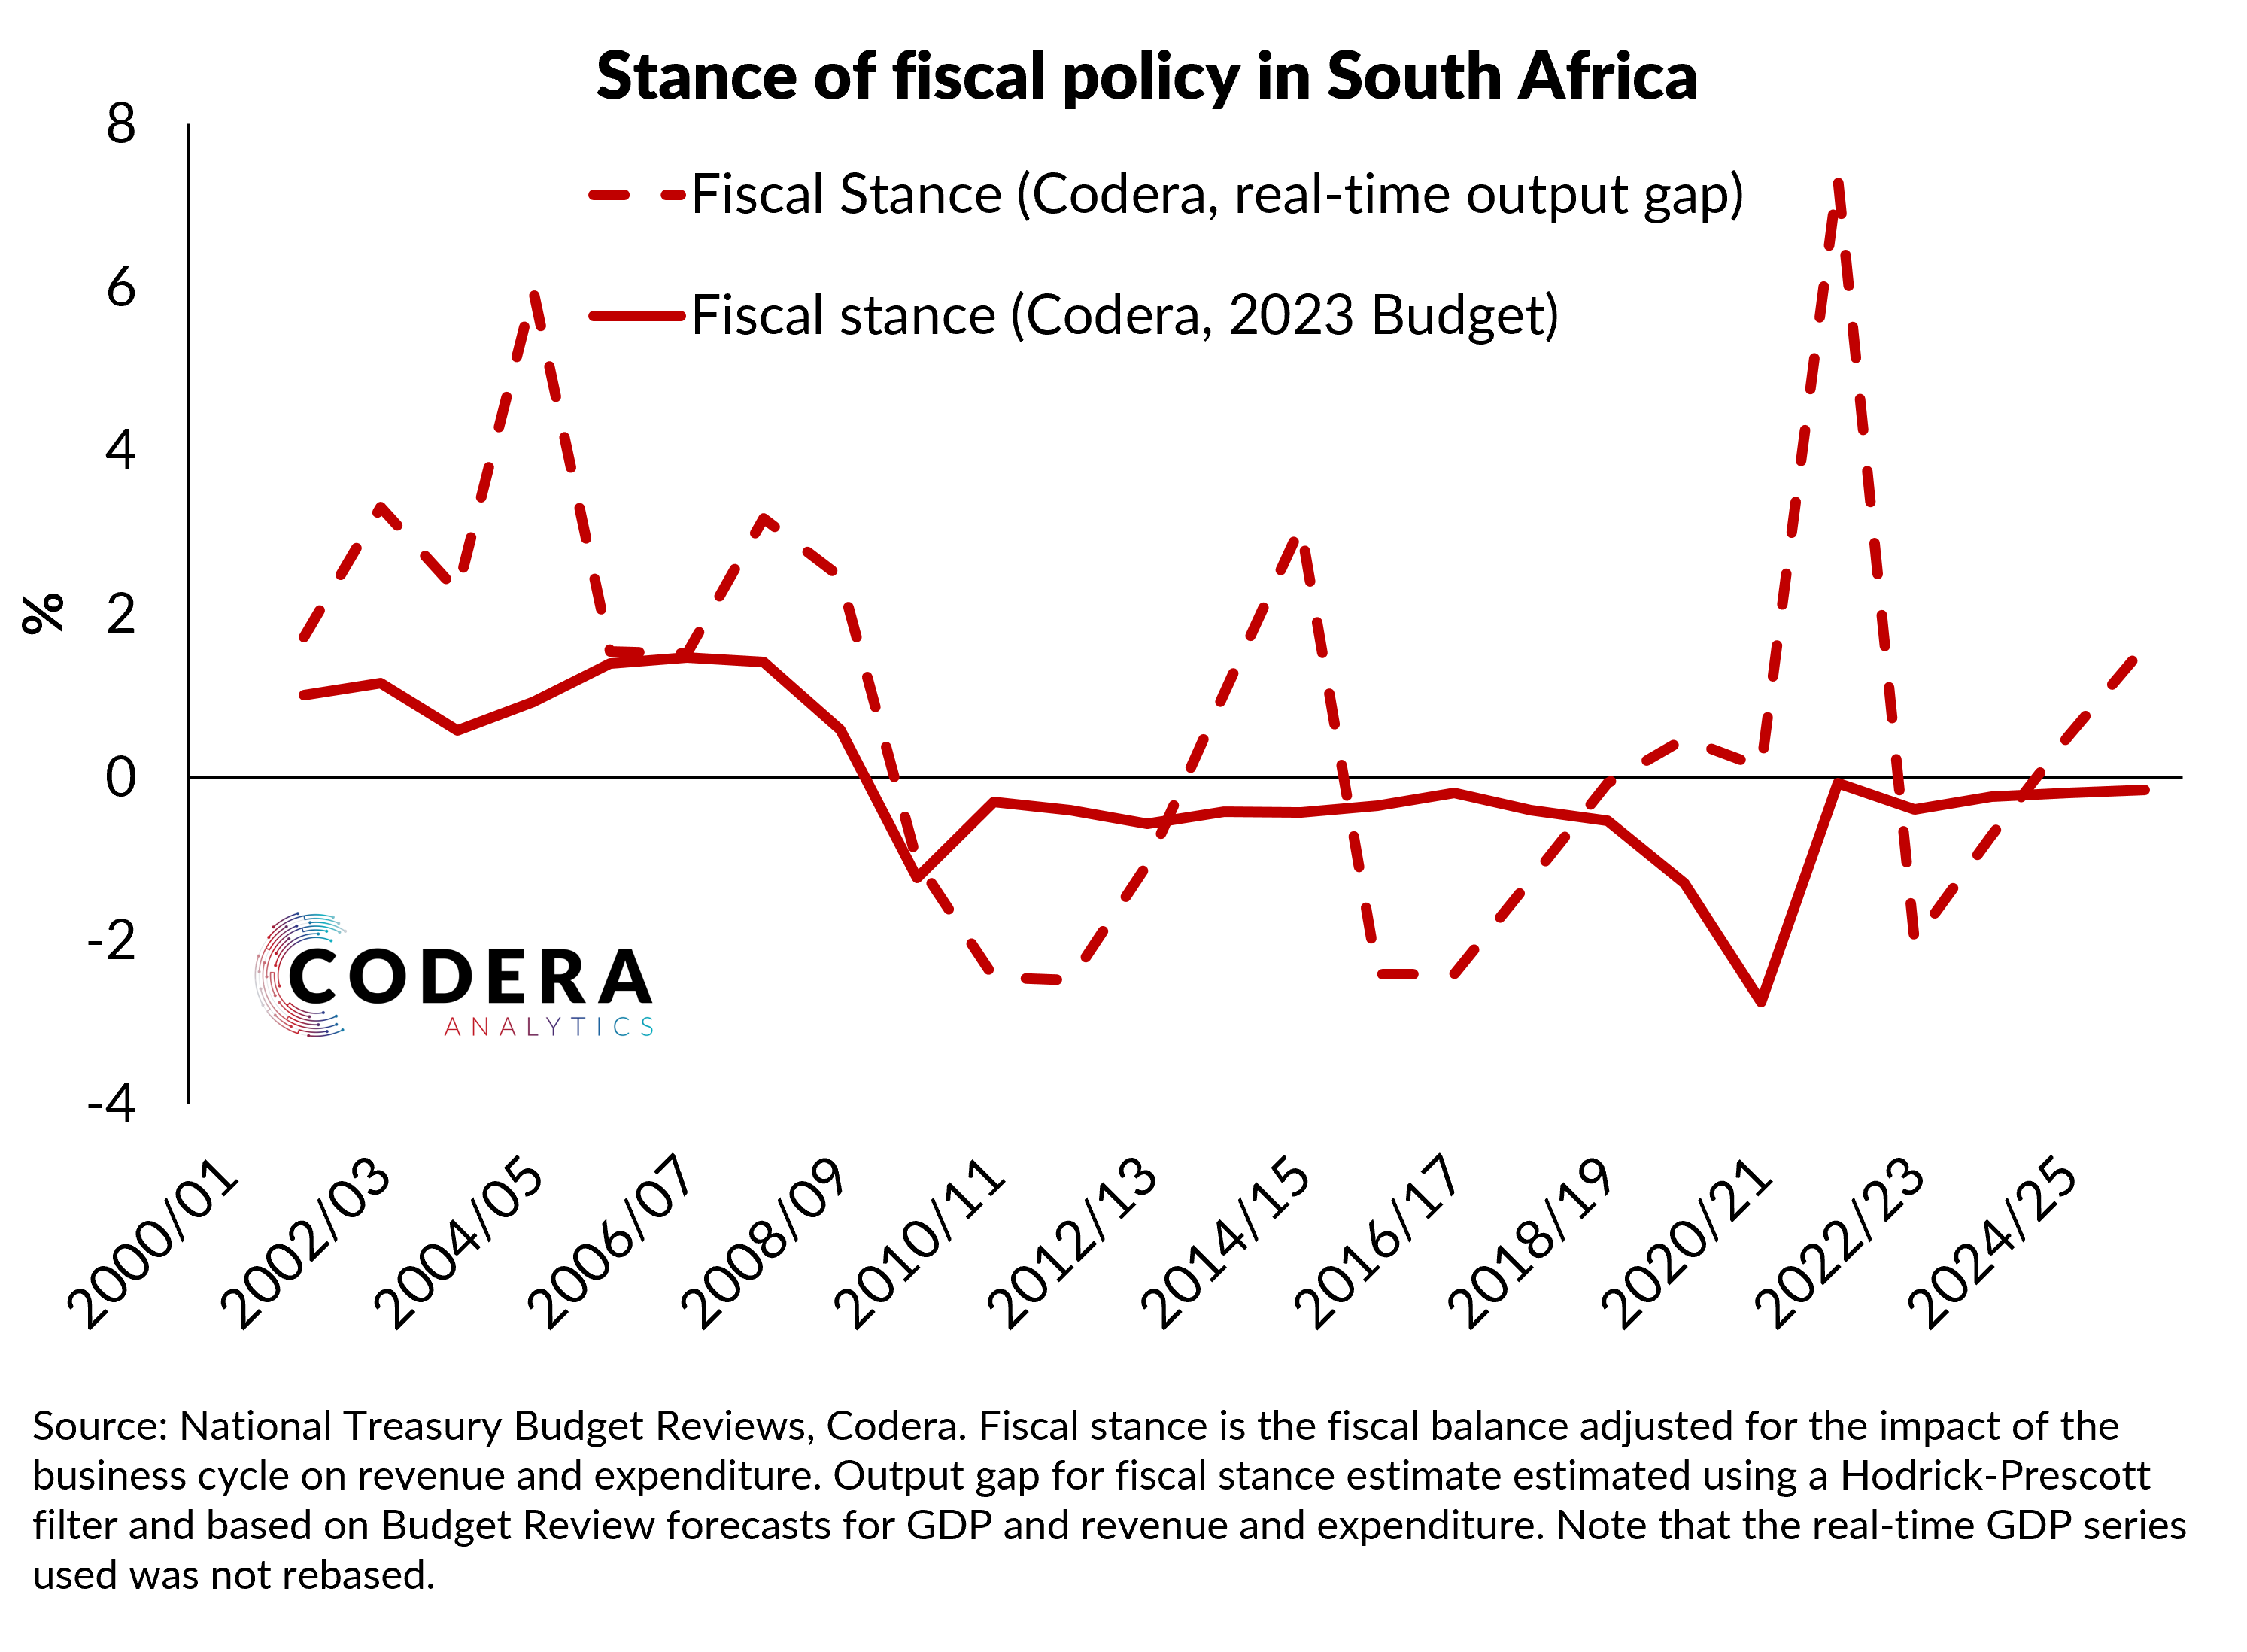
Since GDP data are released with a lag and get revised, it is difficult for policymakers to gauge the extent of current capacity pressures. We do not know what Treasury’s historical assessment of the state of the business cycle was, but we can try to see whether data revisions may have had an impact on assessment of the business cycle and may have affected judgements around how much fiscal space was available at a particular point in time. In the chart below, I re-estimate the fiscal space measure using an estimate of the output gap from a statistical filter applied to real-time GDP data (i.e. as published at different points in time). The real time measure suggests fiscal policy was prudent between 2004 and the GFC, since real time output gap estimates were less positive than those based on ex post data, whereas it is slightly more negative immediately post-GFC. The profile of the fiscal space measure is meaningfully different over recent years if a real time output gap estimate is used. This is because different approaches to measuring the business cycle often produce different estimates. The statistical filter used has a lower level of potential growth over recent years than SARB’s real time potential estimates. If the real-time chart used the SARB’s real time output gap instead, the overall profile would be similar to the ex-post estimates in the first chart.
So to be fair to Treasury, the decline in trend growth and large recent GDP revisions have made it difficult to assess fiscal space over the last several years. To be able to do so more comprehensively, one would need more details from Treasury about their year-to-year assessments of economic trends and the implications for their assessment of the structural budget balance and fiscal impulse to growth.
Footnotes
The cyclical fiscal stance indicator I plot takes the difference between cyclically adjusted real taxation revenue and cyclically adjusted real government expenditure.
The measure in this plot is conceptually different from the more commonly used structural budget balance measure of the fiscal stance, but tells tells broadly the same story as such a measure would.
This analysis uses the main budget, but could be extended to the consolidated government budget.