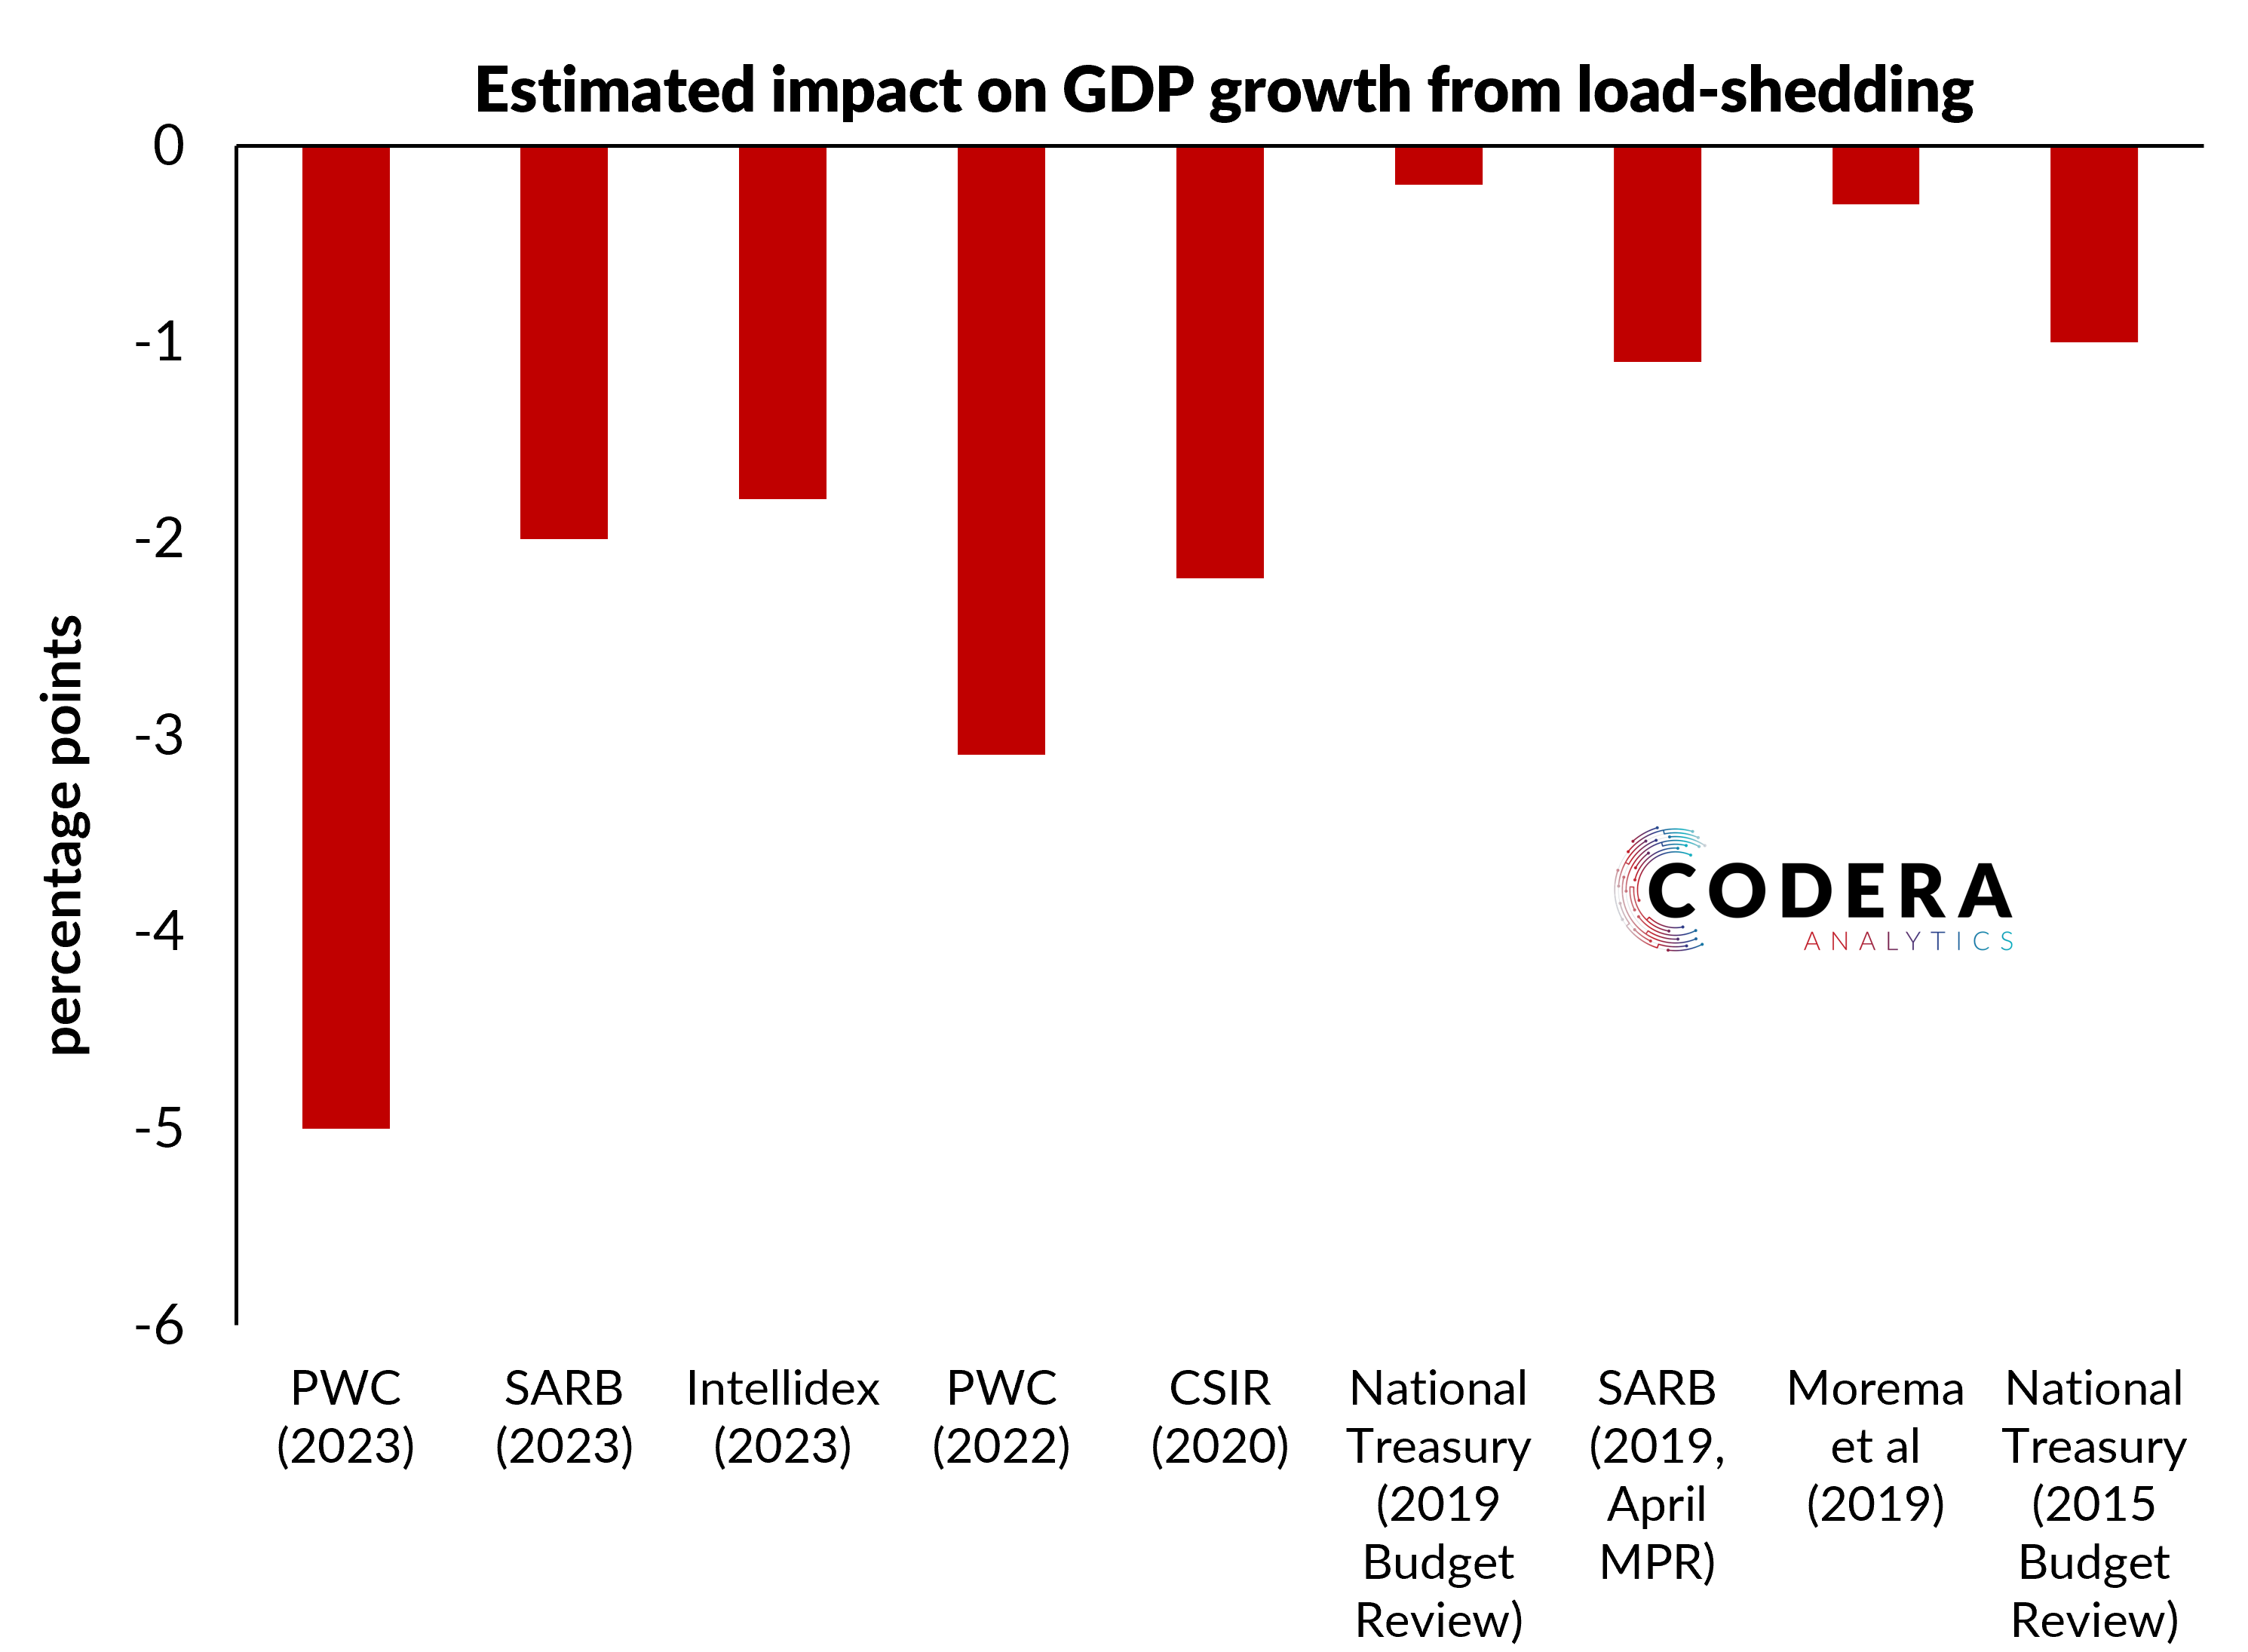
PWC has come out with some headline-grabbing estimates of the impact of load shedding on GDP growth for the South African economy. The figure below updates estimates from an earlier post where I compared existing estimates of the GDP growth impact of load-shedding. PWC’s updated estimate of the impact on GDP is massive: they estimate an impact of up to 5 percentage points for 2022.
They note in their 2023 economic outlook that their estimate of the potential growth rate for the economy for 2022 is close to 7%. This is very high: it is more than 6 percentage points higher than the SARB or IMF estimate for 2022 (here is a historical view of their estimates). Their estimate is also very high compared to what structural and statistical models produce for South Africa: one would gets a potential estimate of around 2% from a production function approach, whereas statistical filters such as a Hodrick-Prescot filter produce estimates close to 0% given the low trend level of growth over recent quarters.
Note that it is difficult to compare estimates of load-shedding impacts because of differences in assumed electricity production losses and assumed economic costs of electricity shortages. The table below summarises recent estimates from a variety of published sources and the basis of their calculation.
| Source | Estimated impact on GDP growth (percentage points) | GDP lost (R million per day) | Description |
| PWC (2023) | Up to -5 in 2022 | ||
| SARB (2023) | -2 in 2023 | R204-R899 million | Stage 3 to 6 for 6 to 12 hours per day |
| Intellidex (2023) | -1.8 in 2023 | 1bn/day for full day stage 6 600mn/day for stage 4 100mn/day for stage 2 |
|
| Alexander Forbes (2022) | 4000 at stage 6 | ||
| PWC (2022) | Up to -3.1 in 2022 | Reduction to real GDP growth, costing the economy up to 400,000 potential jobs. | |
| Western Cape Government (2021) | 500 per stage | ||
| Eskom (Nova, 2021) | -0.4 | 236 in stage 1 to 942 in stage 4 | Growth sensitivity to a 1% Load-shedding increase (as % of electricity sales). |
| Eskom (Nova, 2020) | R35 billion total cost to the economy between 2007 and 2019 in constant 2020 prices. | ||
| CSIR (2020) | -1.1 to -2.2 in 2019 | 700 per stage | Total cost of between 167 to 388 billion between 2007 to 2019, which is equivalent to around 0.3 to 0.7 of cumulative GDP since 2007. Costs in 2019 estimated at between 60 and 120 billion. |
| National Treasury (2019, Budget Review) | -0.2 in 2019 | Estimated decline in GDP growth from expected decline in energy availability in 2019. | |
| SARB (2019, April MPR) | -1.1 in 2019 | Growth impact relative to baseline 2019 forecasts. Employment loss estimated by 125 000 jobs. | |
| Morema et al (2019) | -0.3 in 2019 | 348 in stage 1 to 753 in stage 4 | Assuming load-shedding continued throughout 2019. |
| Goldman Sachs (2019) | -0.9 in 2019 | Estimated decline in GDP growth if load-shedding persisted throughout 2019. | |
| RMB Morgan Stanley (2019) | -0.5 | Growth sensitivity to a 10% power supply cut (annualised). | |
| National Treasury (2015, Budget Review) | -1 in 2015 | Estimated real GDP growth impact of electricity shortages in 2015. |
Footnote
The production function model referred to below is based on a constant-elasticity of substitution approach and the statistical estimates would be the levels of potential implied by a range of statistical filters.
Note that I updated the post after receiving more estimates from economists.