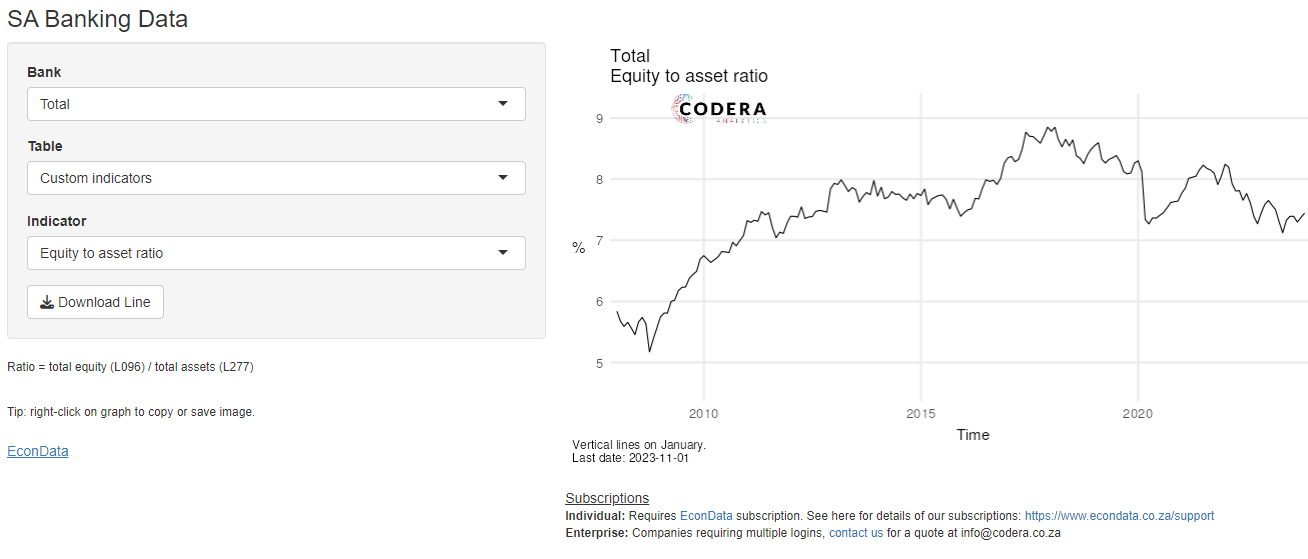
Many equity analysts manually copy bank level regulatory data from monthly snapshots into spreadsheets to analyse historical developments in South Africa’s banking sector. EconData and our Banking Dashboard make it possible to update, download and visualise over 300 accounting line items and custom indicators for South African banks with the click of a button. This also makes it easy to automate any dashboards or analytics that use such data, whether you use R, Python or excel. Get in touch if you would be interested in subscribing. This video provides a summary.