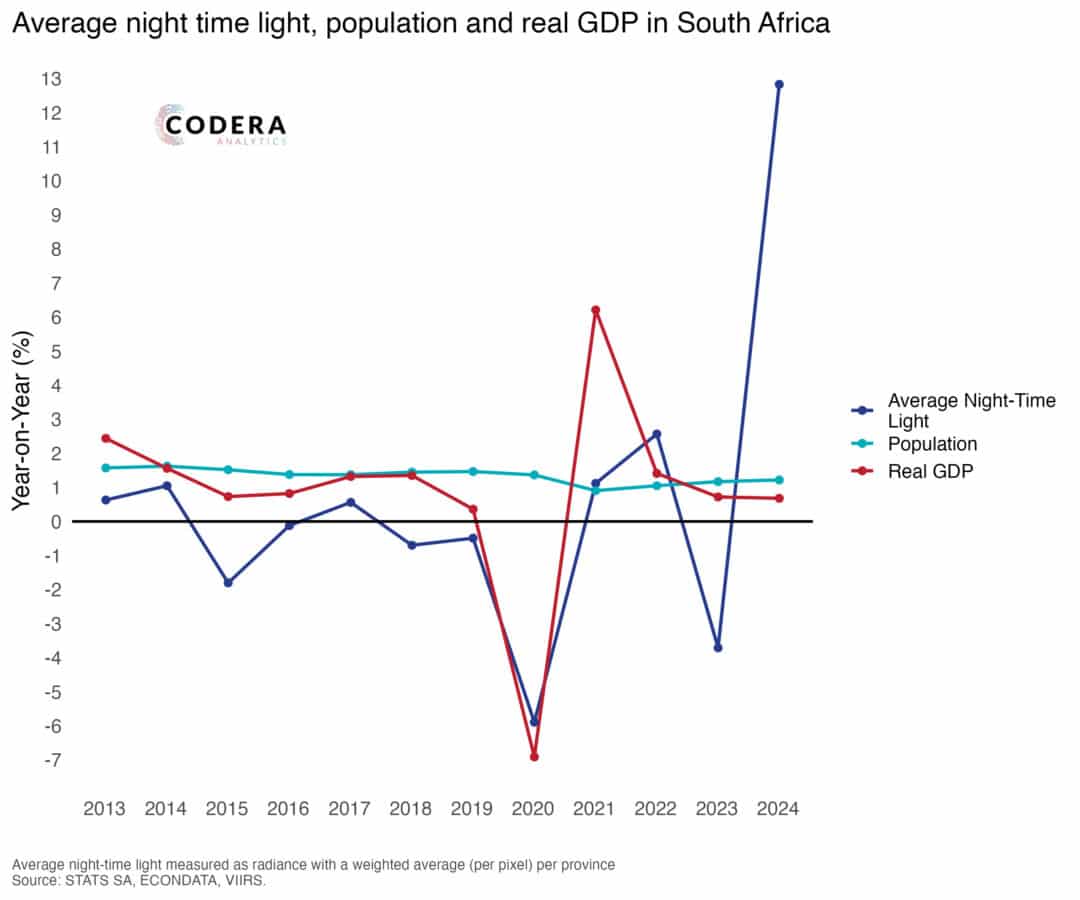
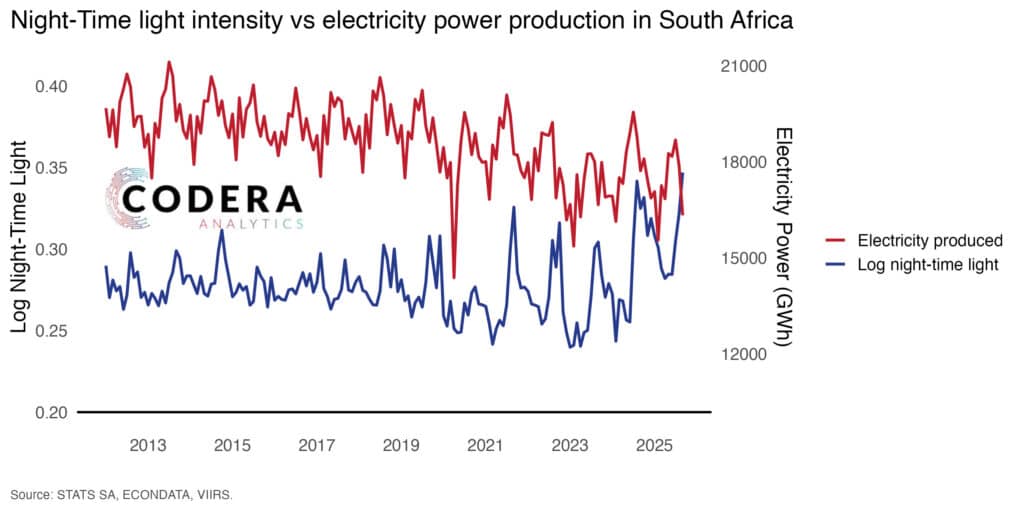
Today’s plot by Tristan Hoyle plots light intensity and power production relative to GDP in South Africa. These figures show the impact of load shedding on electricity distribution and night lights. There is clear seasonality in electricity produced and night light intensity. There is also
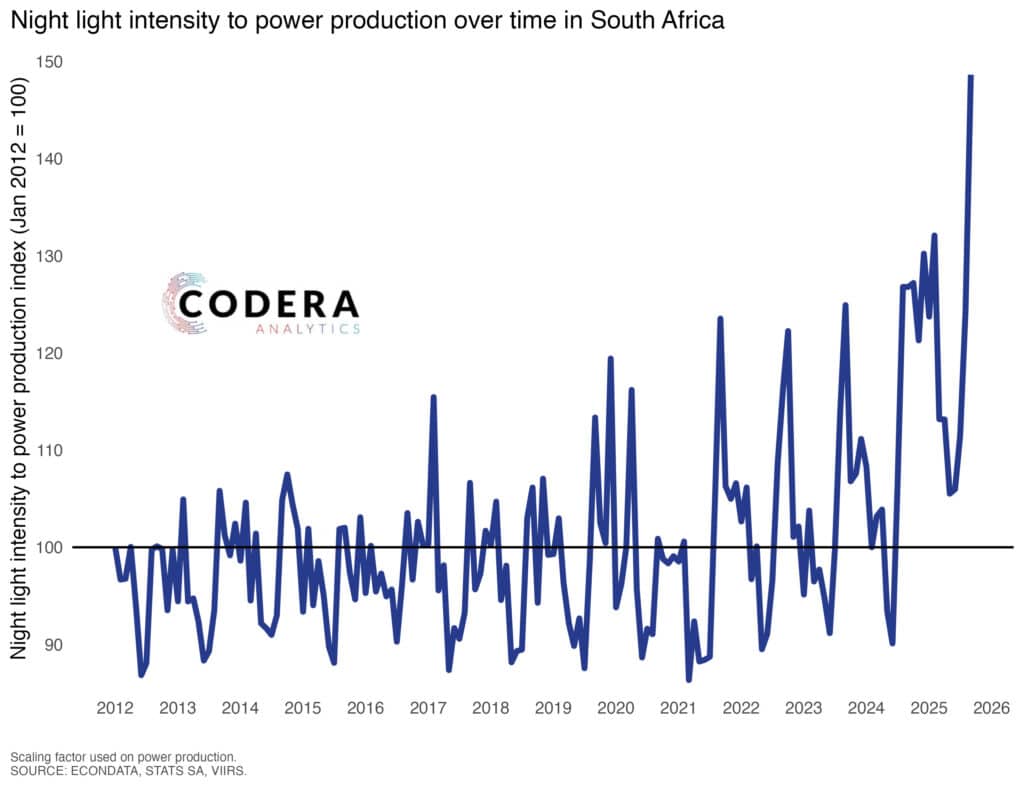
strong monthly correspondence between power produced and night lights. During winter, however, demand for national power generation has tended to outpace night light increases as a consequence of higher heating activity. The impact of the COVID‐19 economic lockdowns are also clear in both series. While electricity distribution in South Africa produced has declined since 2012, national night lights declined until late 2024, and has risen strongly since. Like GDP, when expressed as a ratio of power production, there has been an increase in the intensity of night light for a unit of power in South Africa. It is unlikely that the upward trend reflects the adoption of light emitting diode (LED) light technologies as such technologies provide a similar amount of light (though different colours) but generally use less electricity. Instead, official data on electricity availability do not capture private sector electricity generation, while there has been a decline of South Africa’s industrial base as a result on constrained electricity availability. Given the large increase in electricity prices since 2010 in South Africa, it is also possible that there has been behavioural changes in use of light at night.
Read more in our paper on night light developments in South Africa here.