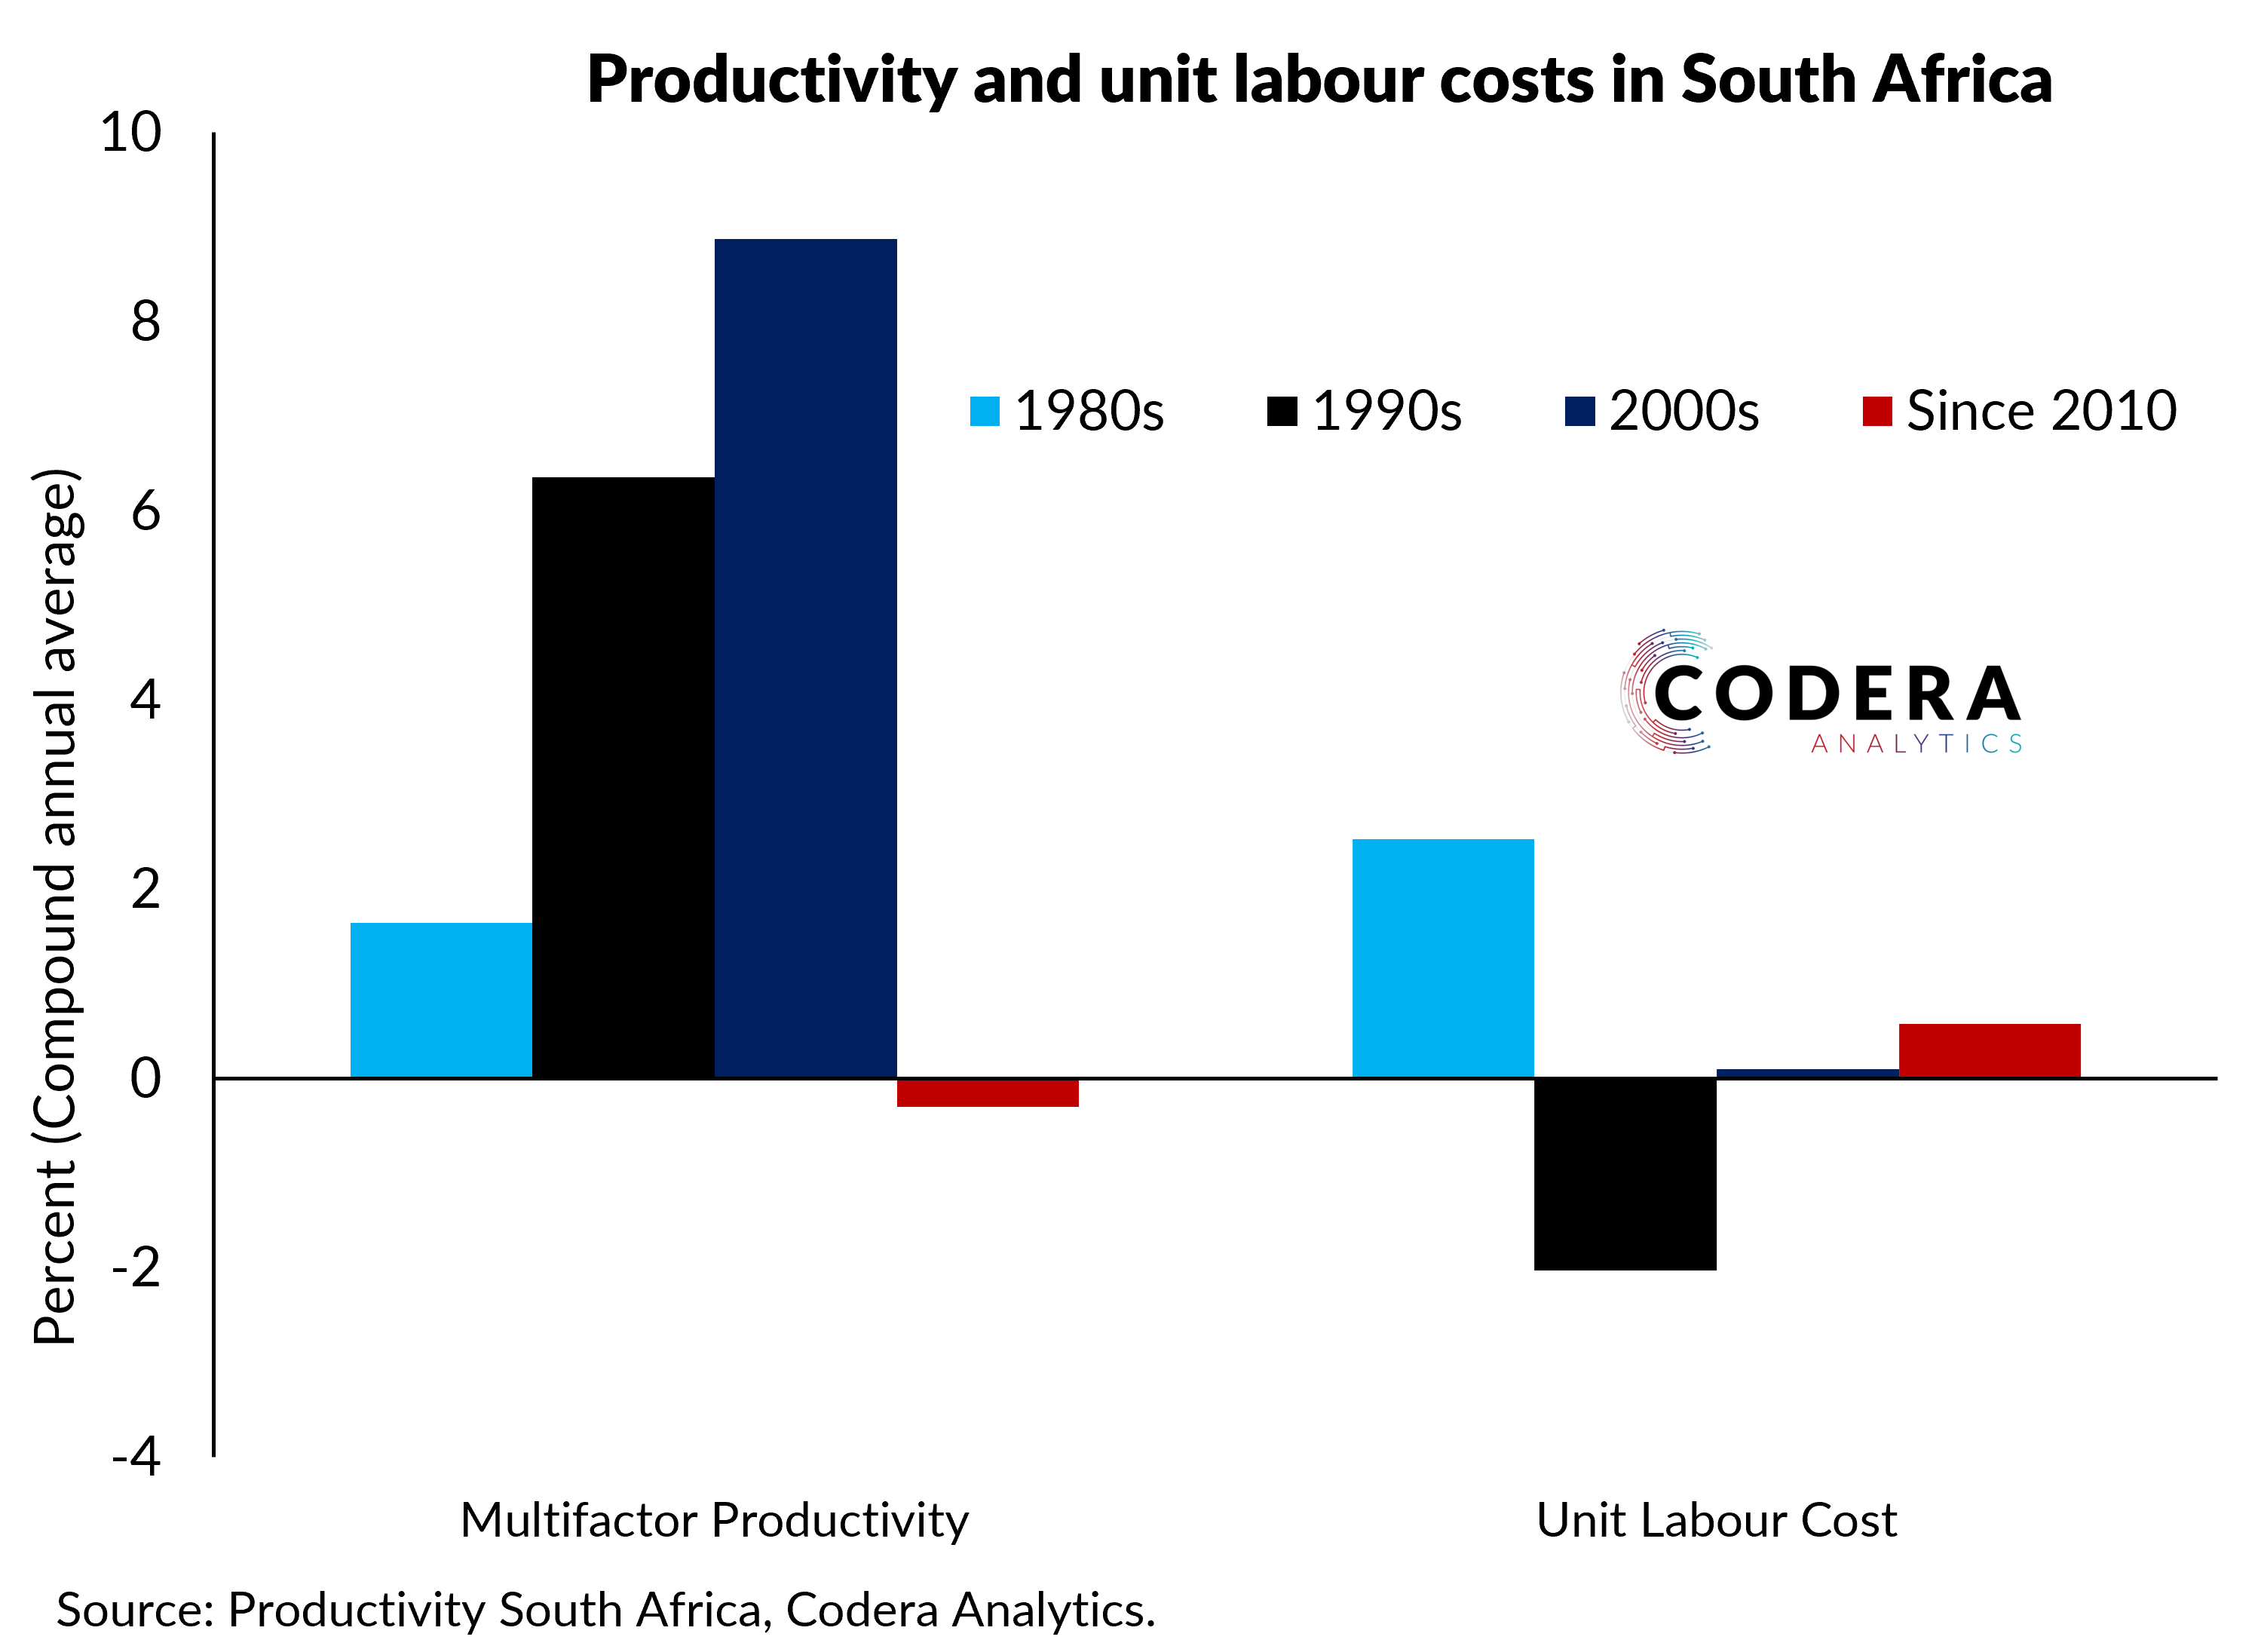
Productivity SA estimates that South Africa’s productivity performance has deteriorated markedly since the global financial crisis. Yet their updated estimates of Total Factor Productivity (TFP) are much higher than their estimates published in 2020 and stand in sharp contrast to much lower estimates from the Conference Board or SARB. The chart shows that their estimates also imply that unit labour cost growth has been higher since 2010 than had been the case over the previous two decades.
Comparison of aggregate TFP estimates to other studies
| Sample | TFP growth estimate (average, percent) | |
| Productivity SA (2022) | 1999-2019 | 4.7 |
| Productivity SA (2022) | 2009-2019 | 0.7 |
| Pain, Rapapali and Steenkamp (2020) Cobb-Douglas baseline | 2009Q1-2020Q1 | -0.5 |
| Pain, Rapapali and Steenkamp (2020) CES baseline | 2009Q1-2020Q1 | 0.5 |
| SARB Core model | 1999Q1-2020Q1 | 0.4 |
| SARB Core model | 2009Q1-2020Q1 | -0.4 |
| Rapapali and Steenkamp (2019) | 1993-2017 | 2.0 |
| Steenkamp (2018) | 1999Q1-2017Q1 | 1.7 |
| Botha et al. (2018) | 2000Q1-2017Q1 | 1.1 |
| Productivity SA (2020) | 1999-2015 | 1.5 |
| Conference Board (2020) | 1999-2019 | -0.1 |
| Conference Board (2020) | 2009-2019 | -1.1 |
| Penn World Table (2020) | 1999-2017 | 1.0 |
Footnote
Unfortunately, Productivity South Africa did not respond to our data query so we cannot assess what might account for differences between their estimates and those of others or why their estimates have changed so dramatically.