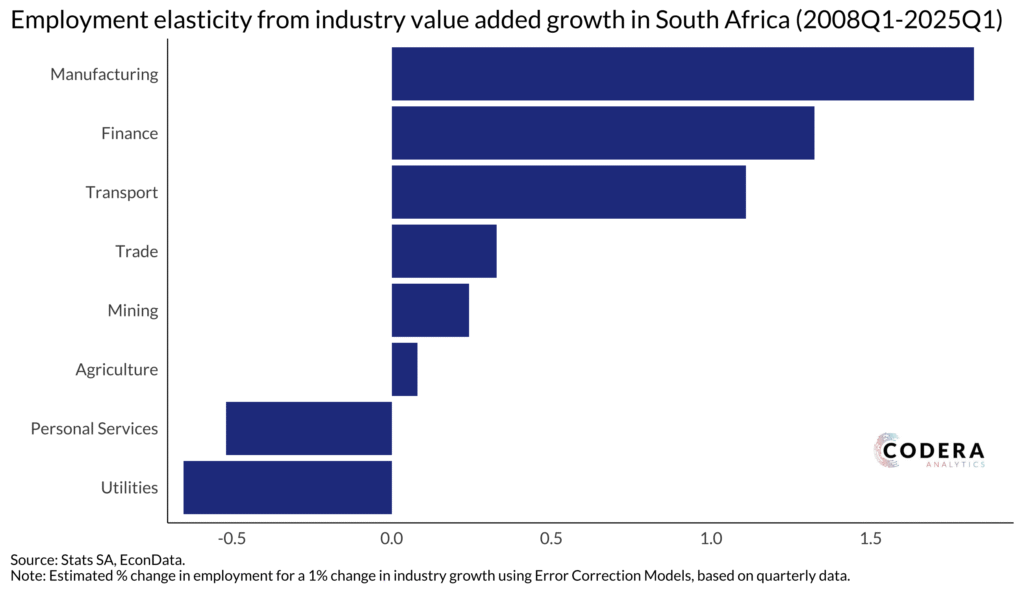
How much does employment in a particular industry respond to economic growth? Today’s post by Gabriella Neilon estimates the employment multiplier for different industries based on employment data from the Quarterly Labour Force Survey (QLFS) and gross value added for each industry.
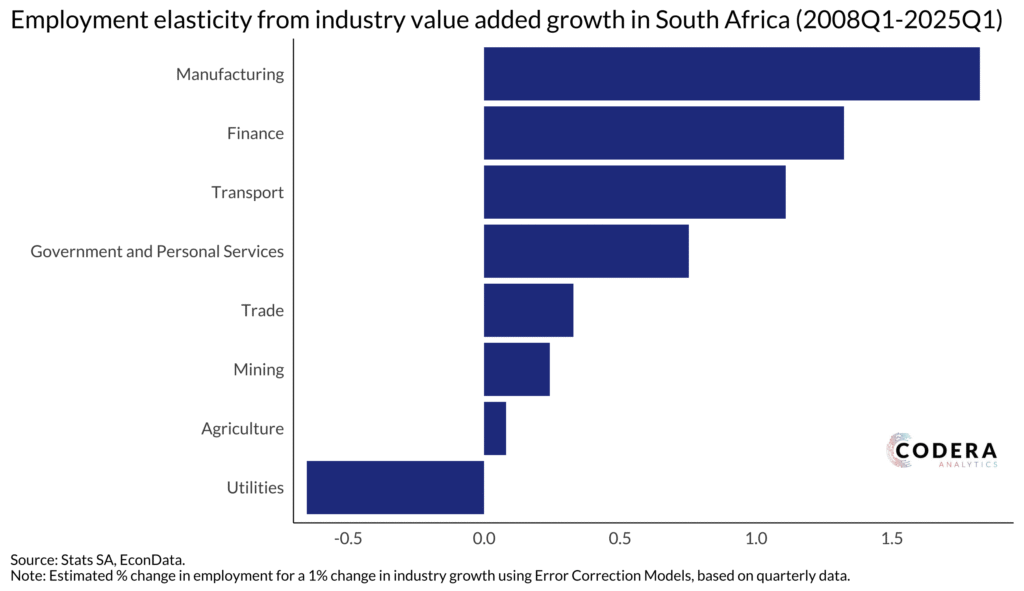
We find that the manufacturing, finance and transport industries have multipliers that are larger than 1-for-1, while electricity and water (‘Utilities’) and personal services have negative multipliers. For personal services, we used national accounts-based personal service gross value added and private household employment. As it is difficult to match categories across the national accounts and QLFS industry categorizations, so we also consider an alternative where we combine government-related and personal services gross value added and community services and personal household employment categories. When combining these components, the multiplier is between 0.5 and 1.
Its important to point out that these models do not control for other macroeconomic and policy factors that affect employment elasticities and that alternative modelling approaches produce different estimates (see earlier estimates here).