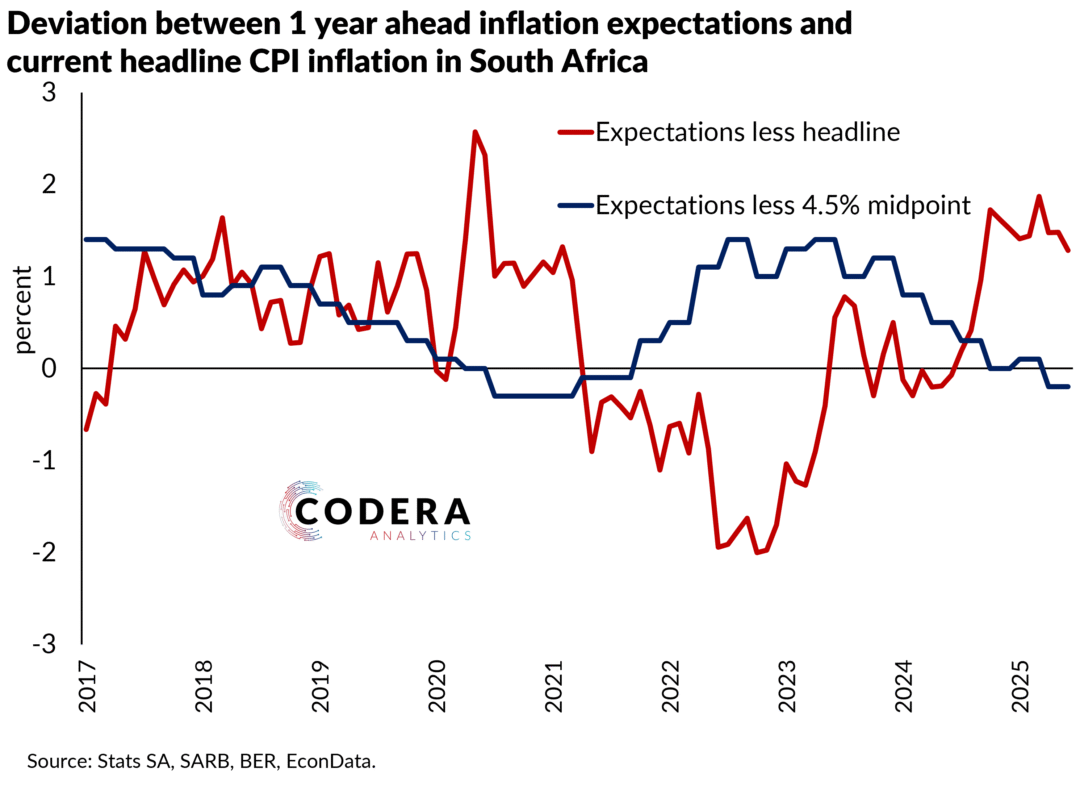
Today’s post compares changes in inflation expectations against the difference between actual inflation and the target as a simple way to assess how anchored expectations are. A positive trend line, as we observe, suggests that as inflation moves away from the target, expectations also shift, indicating less firmly anchored inflation expectations. Interestingly the slope of the line is steeper for the post-2017 period than for the 2000-2017 period. If one instead compares the level of expectations and inflation, or their differences to the inflation target, then one would obtain a higher correlation. This suggests that inflation expectations are fairly tied to current inflation and less anchored than measured in the first chart.