Between 2011 and 2019, the National Treasury expected the GDP deflator to be almost a full percentage point higher than it turned out to be. Since the COVID-19 pandemic, the opposite has been true, with the Treasury expecting a lower deflator than would ultimately be published.

The reason these forecast errors matter is that these projections impact the assessment of what the economic costs will be of servicing our debt in future. The GDP deflator captures, in part, changes in South Africa’s terms of trade (which affect the rate of price increases across the economy) and informs Treasury’s projections of growth in tax revenues. Unlike CPI, the GDP deflator is subject to statistical revision, which complicates its use for adjusting nominal debt servicing costs for inflation.
One explanation for GDP deflator forecast errors is that it has been more difficult to forecast economy-wide prices than consumer inflation since the GFC. However, if one looks closely, it has really only been since the pandemic that the GDP deflator and CPI have diverged. The chart below does, however, suggests that some of the deflator over-prediction may have may reflected that Treasury was caught off guard by the fall in inflation between 2017 and 2020.

Another possible explanation is that the Treasury expected higher terms of trade than eventuated. To be fair to Treasury, other forecasters made similar forecast errors over this period. Most forecasters, for example, were surprised by the fall in our terms of trade immediately after the crisis before it begin rising again around 2016.
Higher terms of trade would usually be expected to push up domestic growth. Over the last five years, during which there has been particularly severe energy availability problems, it may have been that the feed-through to growth from higher terms of trade may have weakened.
But looking deeper at Treasury’s forecast errors, it seems that forecast errors in real GDP and the deflator largely offset each other in the post-GFC to pre-pandemic period. As shown previously, Treasury over-estimated real GDP for the years between the global financial crisis (GFC) and the pandemic. The chart below plots the difference between Treasury nominal GDP growth projections for each fiscal year from each Budget Review between 2008 and 2021 compared to final vintage GDP data (i.e. the latest revised GDP data). The Treasury slightly under-estimated nominal GDP growth until 2018/19, while it over-estimated growth in 2019/20 and 2020/21 (as other forecasters did, particularly given the large magnitude of the economic shock that the COVID shock represented).
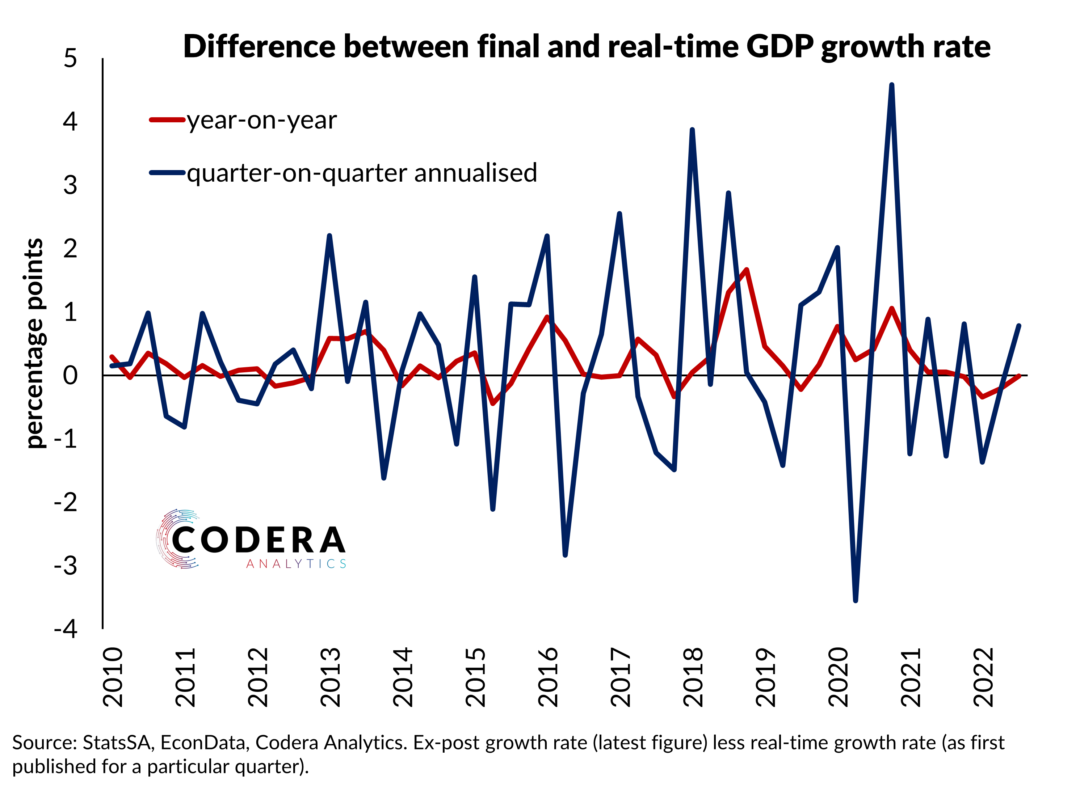
 It is important to note that revisions to GDP affect this assessment. GDP revisions have been positive on average (averaging around 0.3 percentage points year-on-year since 2010), meaning that Treasury historical forecast errors are slightly higher based on the latest available data (i.e. ex-post) GDP than it would have been using earlier vintages of data (i.e. in real-time). After the most recent overhaul of GDP data in late 2021, the upward revision to the level of South Africa’s GDP data brought the Treasury estimates over recent budgets closer in alignment with final vintage GDP estimates. The statistical revisions have also led to a meaningful improvement in the forecasted debt profile.
What does all of this mean? Economists and market analysts should be really concerned that the contribution of real GDP to nominal GDP growth has been systematically lower than before the GFC. This bodes ill for the potential growth rate of the economy and implies that the nominal GDP figures used to calculate our debt-to-GDP ratio may flatter fiscal sustainability assessment. This is also an example of why it is important to have solid real time estimates of GDP, since the discrepancy between real time and ex-post estimates creates economic uncertainty and affects economic policy decisions.
Footnote
Exchange rate movements may have also contributed to GDP deflator forecast errors. For example, if movements in the rand diminished the impact on the rand price of exports (i.e. appreciating on the back of higher commodity prices) it would have lowered deflator growth compared to what might otherwise have been expected. Assessing whether this explanation is reasonable in South Africa’s case would require some modelling.

