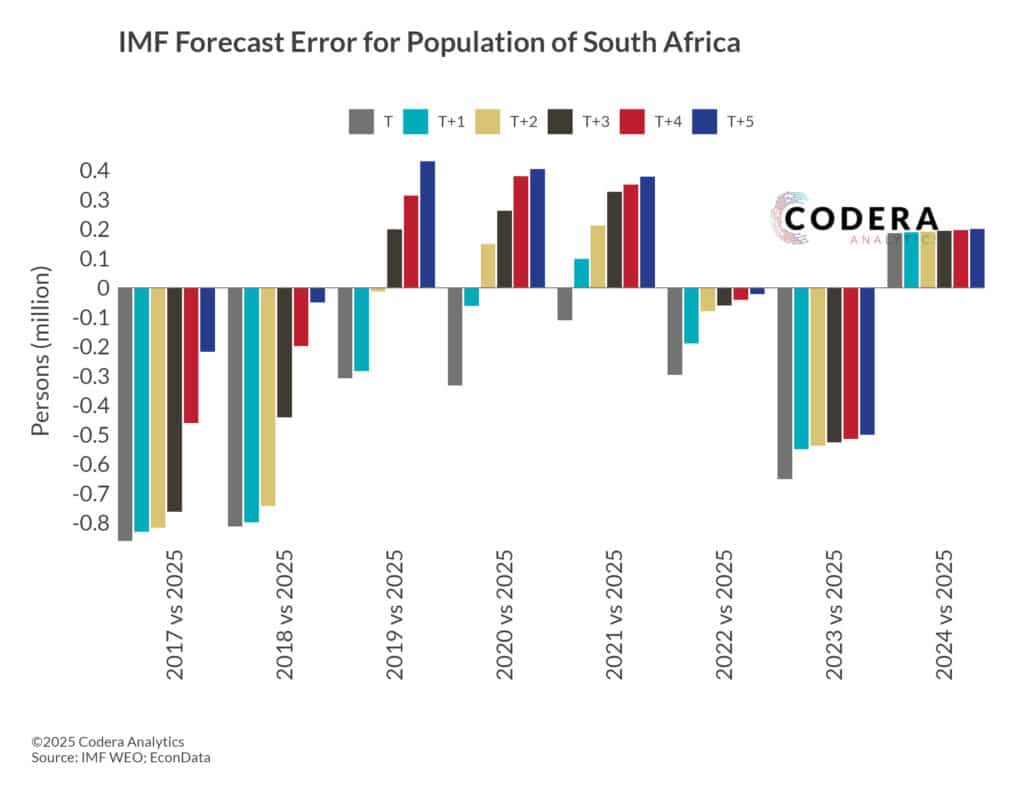
Today’s post by Jan Hendrik Pretorius compares historical IMF forecast errors of SA’s population, comparing current year and each of the 5 year-ahead forecasts against the latest available (2025) estimates. Our chart reveals that there have been large revisions in national population estimates. For an assessment of Statistics South Africa’s population forecasts errors, see this earlier post.
Our EconData platform makes it easy to access historical National Treasury Budget, SARB and IMF projections. Contact us if you are interested in subscribing to subscriber-only datasets.
Footnote
For each vintage, the estimate for a given year is compared with the 2025-vintage estimate for the same year.
Forecast error (percentage points) = vintage − 2025: positive = over-estimation; negative = under-estimation.
Horizon labels: T = that year; T+1 = next year; etc. Example (2017 vintage)
T = estimate for 2017 (2017 vintage) − estimate for 2017 (2025 vintage)
T+1 = estimate for 2018 (2017 vintage) − estimate for 2018 (2025 vintage)
T+2 = estimate for 2019 (2017 vintage) − estimate for 2019 (2025 vintage)