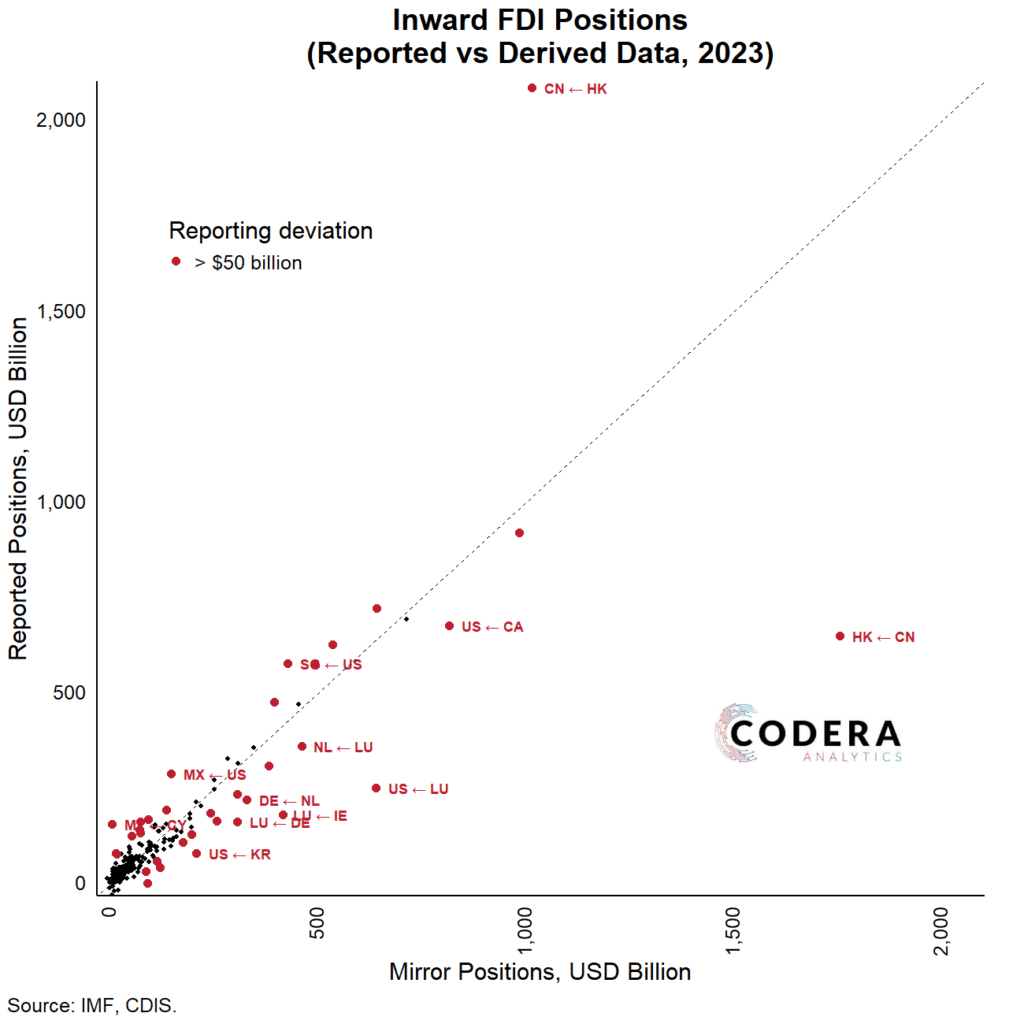
Today’s post highlights asymmetries in bilateral Foreign Direct Investment (FDI) statistics published by the IMF. The first chart show’s recipient countries’ FDI positions on the y-axis and counterpart-countries’ outward positions on the x-axis. While the IMF’s (Coordinated Direct Investment Survey) CDIS database is often praised for its availability of mirror data to substitute missing FDI values for countries which do not partake in the survey, this plot suggests caution when making inferences using mirrored/substituted FDI data. There are, for example, large discrepancies in the FDI positions for Hong Kong to China, China to Hong Kong, Netherlands to UK, Luxembourg to USA and Ireland to Luxembourg.
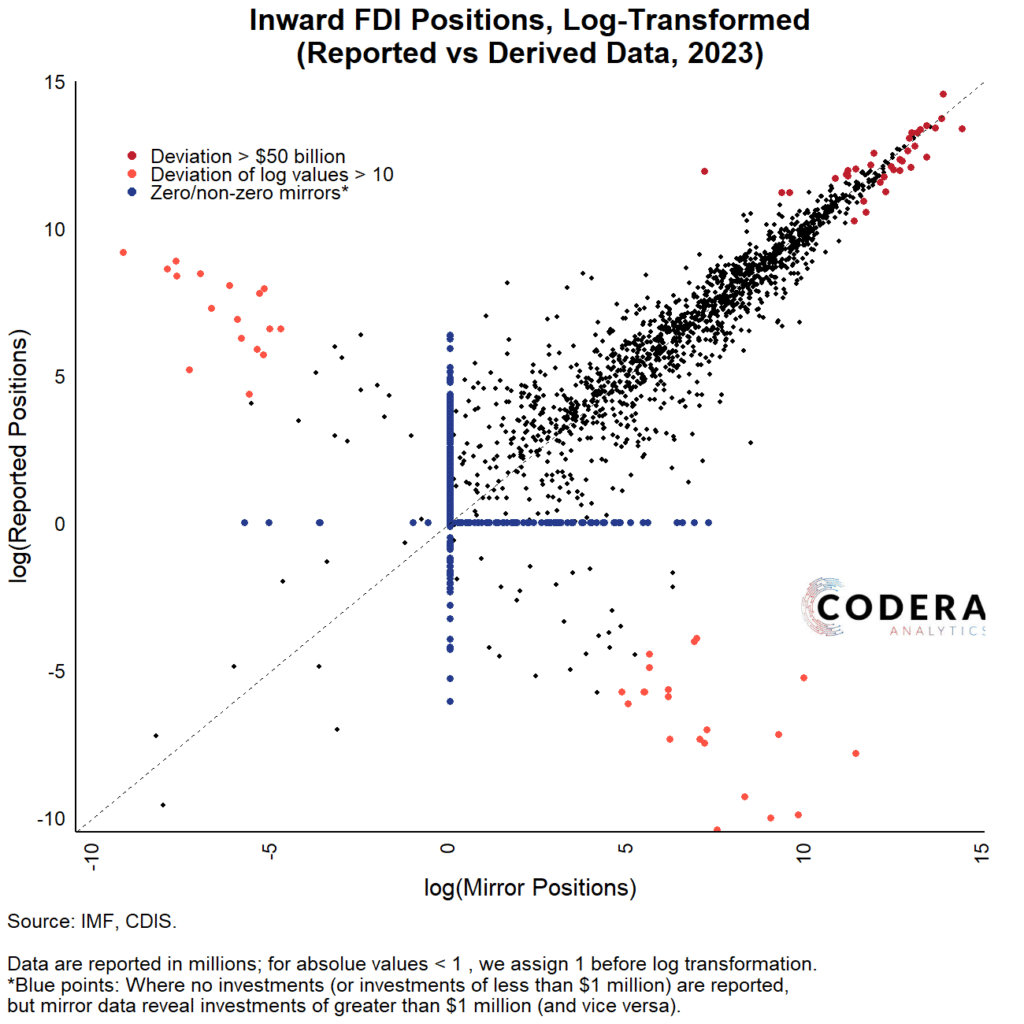
To show this more clearly, we log-transform the data, which flags other potential problems in mirrored FDI data, as there are many cases (highlighted in blue) where countries report FDI inflows of smaller than $1 million (or report that a partner country has no inward FDI position), whilst the bilateral partner reports investment outflows of (often much) greater than $1 million to the destination country in question.
Compiled by Jacques Quass de Vos