How does data availability compare across countries? The World Bank is a major source of country-level economic, financial and socioeconomic data. In this post, we summarise the number of data series available from the World Bank for different countries as a proxy for macroeconomic and social data availability.
There are 28 421 indicators in total across countries available from the World Bank. To give a sense of the scale of the data available from the World Bank, the full dataset has around 290 million rows in long format (i.e. one column that labels all the indicators, and another column that labels the countries or cities).
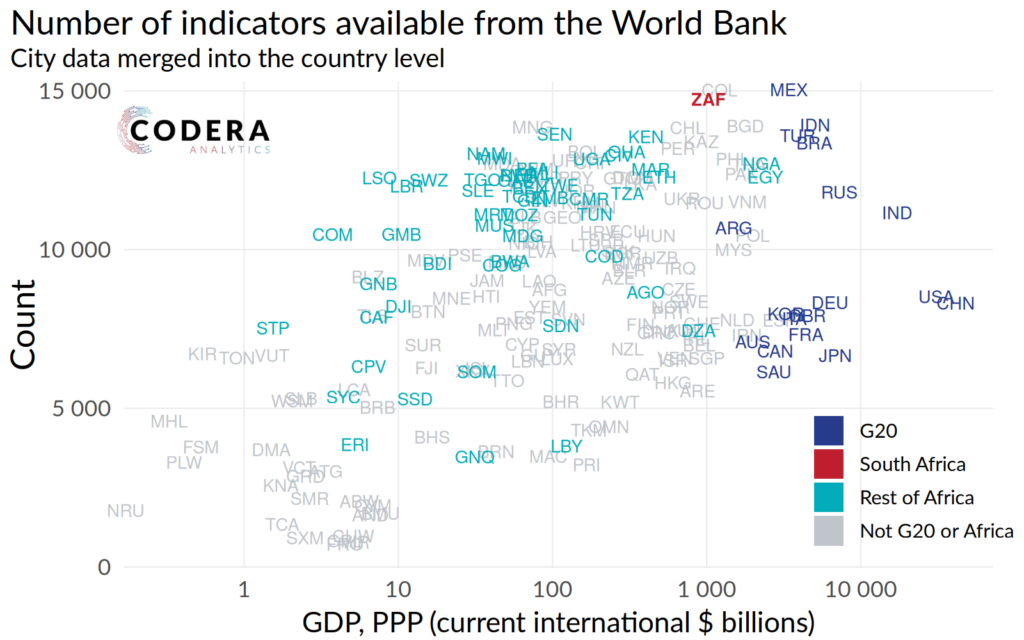
Based on the data we downloaded, South Africa has around 14 736 out of the available indicators, or 52% overall coverage. This is higher than for the median across all countries of around 8346 (around 29% coverage), compared to around 8329 for the median among G20 economies (40% when restricting the number 20941 of available indicators to the G20).
The chart below suggests that South Africa compares favourably to wealthy countries and other emerging markets in terms of the volume of indicators available.
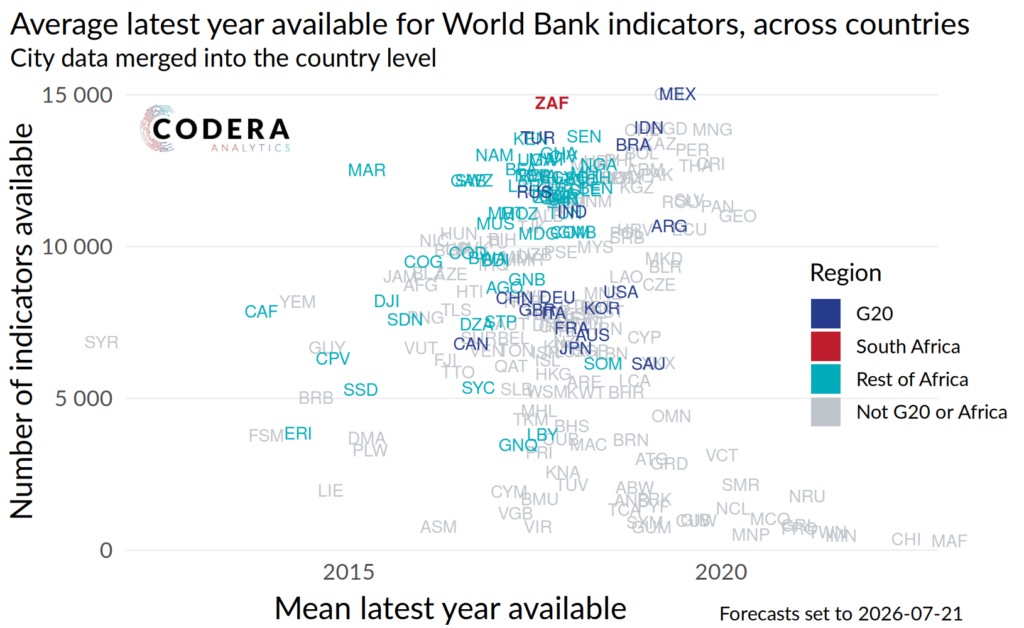
However, South Africa’s indicators are available on a less timely basis than for many major economies. So, while South Africa does not lag on data volumes, this data source suggests that policymakers and firms in South Africa have to make decisions with less up-to-date information than in peer economies. One would also expect an inverse relationship between volume of data and the average last update of data series, as series on the fringes of availability are less feasible to maintain. However, South Africa has a similar volume compared to other G20 countries with less timely data.
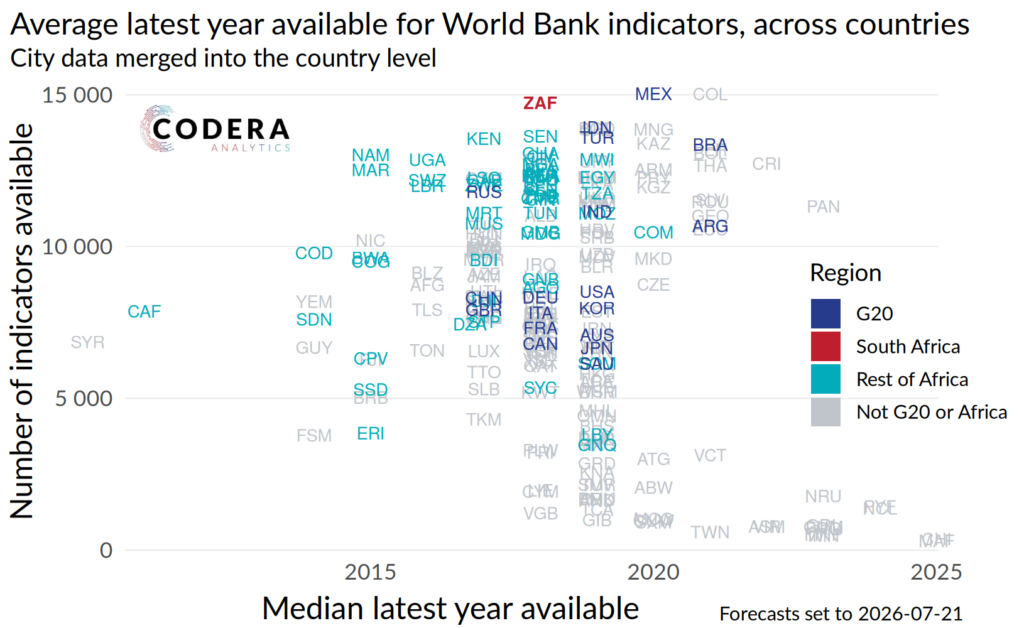
Because some indicators may be discontinued, we also plot the median latest year available in the following chart. This raises the average year by an interval of about one year, with most countries having a median year of availability from all their data around 2018–2019, as of July 2026 (when the data were extracted). The majority of indicators are released on an annual basis, which is why it looks discrete.