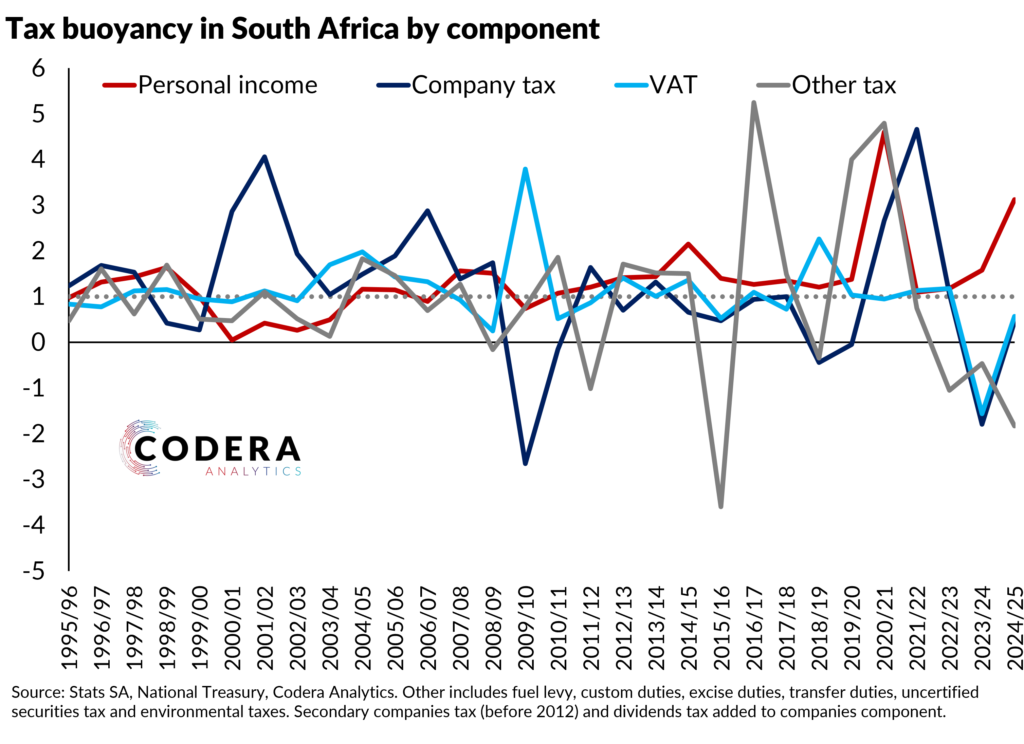
Tax buoyancy measures how tax revenue changes in response to changes in national income and tax compliance. Today’s post compares historical tax buoyancy for the components of tax revenues in South Africa, showing that since 1994 it has been 1.05 for personal income, 1.15 for company income, 1.15 for VAT and 0.8 for other revenue components. As we showed in earlier posts, profits for industries like mining was generally low on account of loadshedding and other policy-related constraints that prevented the industry from taking advantage of multi-generation highs in commodity prices. Profits and tax contributions however did rise strongly after the COVID-19 pandemic. Outside of the immediate post-pandemic period spike, revenues have generally disappointed compared to Treasury forecasts (see here and here for historical forecast analysis), even though buoyancy has been higher than expected for 2024/25.