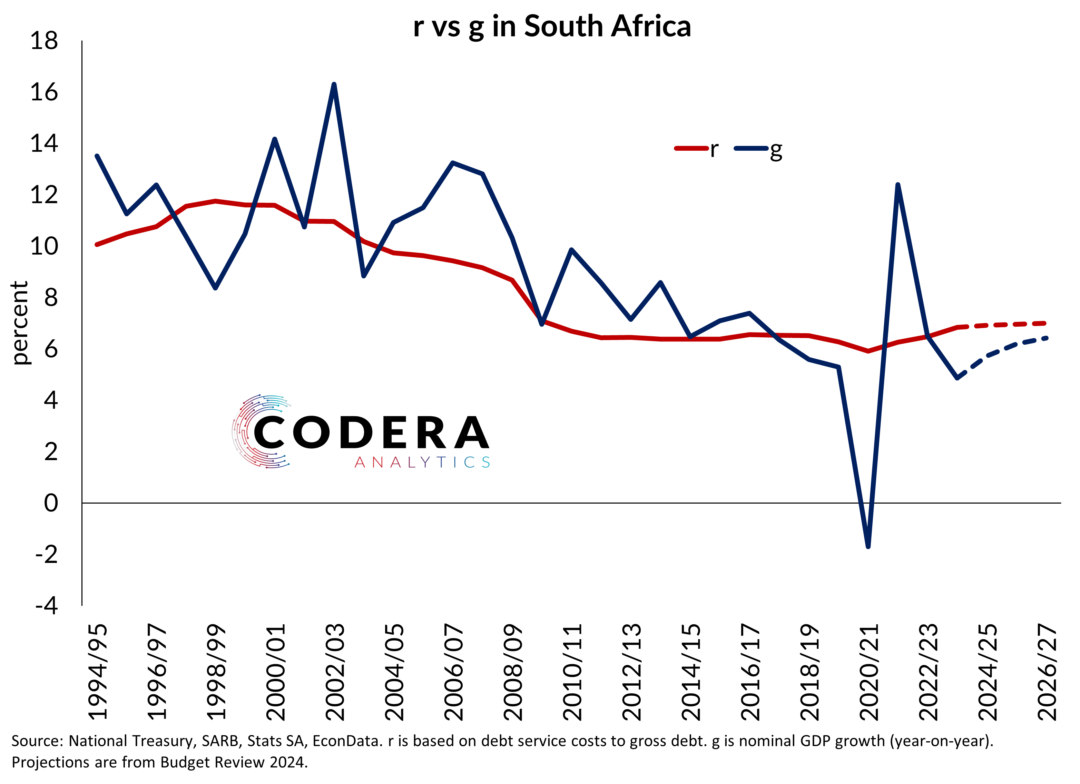
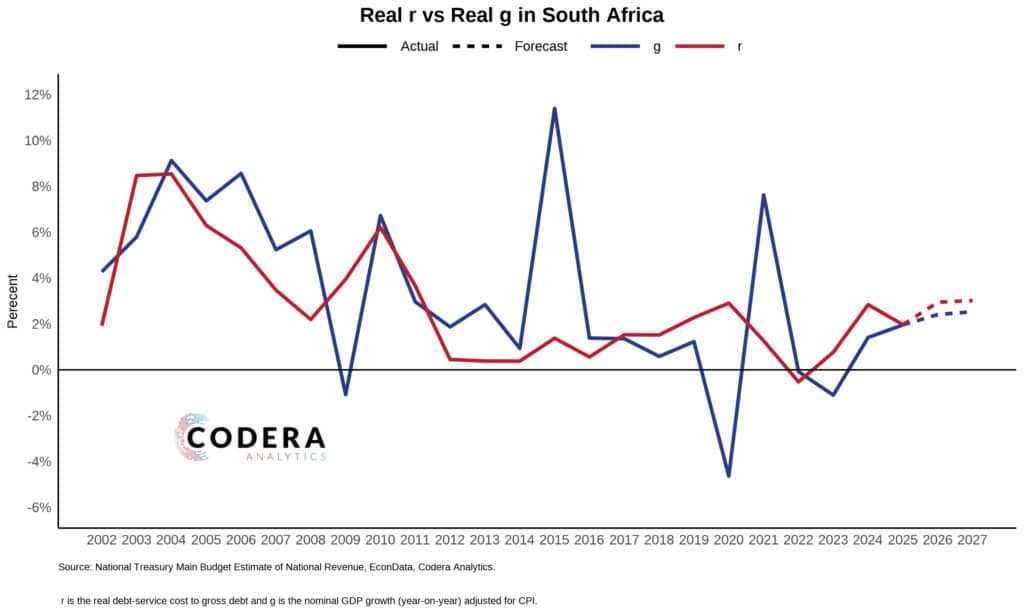
Economists often use a shorthand to assess the public debt outlook: government debt typically increases when borrowing costs exceed economic growth (r > g). This has been the case for South Africa for much of the period since 2017.
Our EconData platform makes it easy to access historical National Treasury Budget projections. Contact us if you are interested in subscribing to subscriber-only datasets such as the Public Finance Module.
Compiled by Sinead Morrow
Footnote
It is important to note that there are many different ways to measure r and g, see here and here for some alternatives for South Africa. These alternative measure show that for more than a decade, r has been higher than g in South Africa. The opposite has been true in economies such as Australia, Canada, China, India or the United States, particularly before the COVID-19 pandemic.